This is a round-up of what CIM customers and partners have actually achieved with the PEAK Platform. Every result below was confirmed in the building's own data, and every one of them links to the full write-up, so you can check the working rather than take the number on trust.
The wins are grouped by what they prove, not by customer. Plant running when nobody is in the building, control settings quietly costing money, faults caught before occupants noticed, money found outside the energy bill, ratings protected, and what engineering and service partners get out of running PEAK for their own clients.
Key takeaways
- The biggest wins are usually operational, not capital. A US high school cut facility electricity 35.5% by putting 21 units back on schedules. A Melbourne museum cut mid-winter chiller runtime from 37% to 2.5% by changing two control settings, with no capital spend.
- Small sensing and control errors cost real money. An outside air sensor installed inside a riser was reading more than 4°C out. A chilled water valve sat 40% open while the BMS commanded it to 0%.
- Independent monitoring catches what the site's own systems miss. PEAK flagged a failed school chiller on a morning when the district's own BMS front end was down.
- Not all of it is energy. Water leaks, meter faults and billing errors have returned tens of thousands of dollars a year and protected NABERS ratings tied to sustainable finance.
- Partners build businesses on it. Aero Performance Group grew its active project portfolio 50% without adding resources, and CSR Sustain is running about £120,000 a year out of one Manchester campus.
How do you tell a verified building result from a modelled one?
A verified building result is one measured in the building's own trend and meter data after the change was made, against a like-for-like baseline. A modelled result is calculated from assumptions about what a change should deliver. Verification means the data confirms the fix held, not that someone expected it to.
Most building performance claims are modelled. Someone estimates what a measure will save, the measure is installed, and the estimate gets reported as the outcome. That is fine for business cases and useless for operations, because plant drifts, overrides get left in place, and schedules get disabled for reasons that outlive the reason.
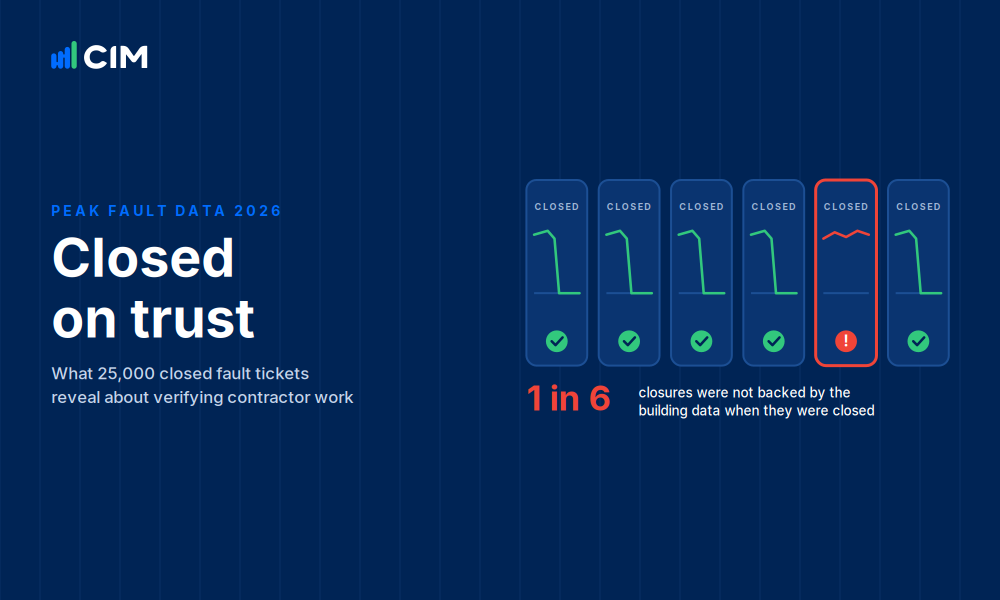
The results in this article are different in one specific way. Each one was found in continuous data from the existing building management system, acted on by the site or contractor team, and then checked in the same data afterwards. In the CIM sample, about 1 in 6 closed fault tickets were closed before the data confirmed the fix, which is exactly the gap that independent verification is there to close. More on why that independence matters in 7 things to know about independent building monitoring.
What happens when plant runs around the clock and nobody notices?
It is one of the most common and most expensive findings in commissioning work. Schedules get disabled after an incident, or the control system never had scheduling at all, and the building keeps heating, cooling and ventilating empty space for years. Correcting schedules is usually free and the savings show up immediately.
At Joliet Central High School in Illinois, every HVAC system across a 550,000 sq ft campus had run 24 hours a day, seven days a week, for years. Two old decisions had hardened into the default: the building automation system had no scheduling function, and schedules had been disabled years earlier after a coil-freezing incident. Nobody chose round-the-clock operation. It was simply never undone.
CIM partner Aero Performance Group connected the school to PEAK through the ComEd Energy Efficiency Program's monitoring-based commissioning offering. Within five months, 21 air handling and rooftop units were back on occupancy schedules and the savings were verified, not estimated. The district paid nothing: the implementation was fully funded by the utility.


The Glasgow site is a good illustration of how ordinary the cause usually is. The facilities manager reviewed the BMS time schedules after a PEAK alert and found several time zones wrong: some enabling fan coil units at 3am, others running 24 hours including weekends, which in turn kept the WC extract fans and two main air handling units running. Correcting the time zones dropped the main plant's energy use by more than 33%.
How much does one wrong control setting cost?
More than most teams expect, and for longer. A deadband set too tight, a lockout that never engages or a sensor in the wrong place raises no alarm and shows up in no bill review. It simply runs plant that does not need to run, every day, until somebody reads the trend data.
At a heritage museum in Melbourne, a buffer tank had been installed for one job: keep the chiller off through winter. It was not doing it. In the middle of winter the chiller was still running 37% of the time. Working back from chiller run hours through every unit calling for cooling, the CIM engineer found a temperature deadband on two fan coil units set at just 0.3°C, far too tight, holding their chilled water valves cracked open with no real demand behind them. Two other units serving the same gallery were calling for cooling every night regardless.
buffer tank in place
deadband and schedule corrected
At an office tower in Sydney's CBD, the building's outside air temperature sensor had been installed inside a riser, so the BMS had been making economy cycle and chiller decisions based on air that was not outside, with more than 4°C of error in the reading. Relocating the sensor was one of nine winter optimisation strategies delivered on site, together cutting chiller runtime by 88% year on year and business-hours electricity by 12%, worth 12,114 kWh over three months. The site had no remote BMS access, so every change was worked through in person with the facilities manager and the BMS technician. Read how the sensor was found.
The fastest example is from a landmark commercial tower in Canary Wharf. Twenty minutes into a first training session with a deliberately sceptical engineering team, PEAK raised a live alert on a full fresh air handling unit: chilled water valve commanded to 0% while supply air ran more than 3°C below outside air. The valve was actually 40% open. Ninety-eight minutes after the session began, two of the engineers who had pushed back hardest had verified the fault on the ground and logged the evidence themselves, on an estimated £25,053 a year. Read the 98 minutes.
What gets caught before anyone in the building notices?
The faults that matter most operationally are the ones resolved before occupants are affected. That depends on monitoring that is independent of the systems being monitored, so that a failure in the site's own controls or front end does not also take away the visibility needed to respond to it.
At a high school in a US public school district, a newly installed chiller had been faulting and dropping offline. One Monday morning it failed again, on the same morning the district's own BMS front end was down. The district's team could not see the chiller at all. PEAK could, because it collects independently of the front end. It flagged the failure first thing, CIM's US engineering services partner ADG Energy confirmed from chilled water trends within 30 to 60 minutes that the building was at real risk, and a technician was dispatched in time to correct the problem before teachers or students knew anything was wrong.
That pattern, a recurring fault on recently installed plant now on the record, is also what gives a site leverage with the installing contractor. We covered how to build that evidence trail in how to verify a fault was actually fixed and in a case where PEAK uncovered a costly oversight. Read the chiller story.
Where does the money show up outside the energy bill?
In water, in metering and in billing. These are rarely the reason a platform gets bought, and they are often the fastest payback in the first year, because a leak or a faulty meter runs continuously and nobody is watching the hourly profile closely enough to catch it.



What does this do to ratings and tenant comfort?
Ratings follow operations. NABERS, and the sustainable finance arrangements increasingly tied to it, reward buildings that run well all year rather than buildings that were designed well. Continuous monitoring protects a rating between assessments, and over several years it can move a building several stars.
Kyko Group's 193 North Quay in Brisbane, a 10-storey office originally built in the 1970s, went from a zero star NABERS rating to five after deploying PEAK. At the same group's 99 Elizabeth Street, a 15-level boutique office carrying an indicative 1.5 star rating at refurbishment, the target was 4.0. The building reached 5.5 stars within three years on a six month payback, using data that already existed in the building rather than new capital works.
Demand management is the other side of it. At Eastland in Melbourne, QIC Global Real Estate's operations team used PEAK insights to optimise HVAC plant ahead of critical peak demand days, nominated by the network operator on the hottest days of the year, and achieved a 15.4% combined demand reduction across the shopping centre on those days. For portfolios, the same discipline is what holds a NABERS Water or Indoor Environment rating in place when something goes wrong at one site.
What do engineering and service partners get out of it?
Three things, consistently: more buildings covered per engineer, a recurring revenue line that sits alongside project work, and evidence they can put in front of their own clients. The platform is the delivery mechanism, but the commercial result is capacity and retention.
Aero Performance Group, an award-winning division of the Hill Group based in Chicago, grew its Consulting Services division's active project portfolio by 50% without any additional resourcing, and now verifies around 6 million kWh of utility incentives a year. Real-time visibility also changed the shape of its engagements, with fixed-term projects converting to longer-term ones more often. Read the Aero case study.
Hoffman Building Technologies took a different route and deployed on itself first, putting PEAK across its own 180,000 sq ft Charlotte headquarters so the site could act as a live showcase for its clients. Full onboarding and rule configuration were completed in under 20 days, with 576 rules deployed across 63 items of equipment and 37 thermal zones, over 1,000 points streaming every 15 minutes, and 229 alerts identified in the first six months. One air handling unit alone saw a 58% fan power reduction. Read the Hoffman case study.
In the UK, CSR Sustain runs its own PEAK-based service. At the Exchange Quay office campus in Manchester, electricity consumption across the estate fell 10.8% year on year in Q1 2026, a saving of roughly £30,000 in three months, which at that run rate is around £120,000 a year, achieved purely through operational optimisation with no capital expenditure. Read the CSR Sustain case study.
If you are weighing up how to package this kind of work commercially, our Guide to Unlocking Operational Savings Across a Commercial Portfolio sets out where the recurring savings usually sit, and how to structure an analytics-backed maintenance contract covers tiers and KPIs.
Where does CIM's PEAK Platform fit?
PEAK reads the existing building management system, read only and with no new hardware, applies engineering rules to the trend data, turns what matters into assigned actions, chases them, and then checks the data to confirm the fix held. That last step is what separates the results above from a list of alerts.
CIM is independent: it is not owned by any equipment, controls or BMS manufacturer, which is what makes it credible to verify work carried out by the contractor or the controls vendor on the same site. PEAK is used across more than 700 commercial buildings and more than 100 million square feet, with more than 20 engineering and service partners delivering on it. More than 5,000 engineering rules are available, and buildings are typically live within about 30 days.
If you are evaluating platforms, how to write a building analytics RFP sets out the questions worth asking, and how FDD platforms help engineers triage and verify faults covers what happens after an alert is raised. Partners should start with how contractors prove the value of maintenance work.
See what your buildings are hiding
Every win on this page started as trend data nobody was reading. See how PEAK turns it into actions your team can close and verify.
Talk to our partner teamWatch a demoFrequently asked questions
Which building analytics platforms show measurable payback for commercial property portfolios?
Look for platforms that publish verified results rather than modelled ones. CIM's PEAK Platform has documented wins including 35.5% less electricity at a US high school, around £120,000 a year at a Manchester office campus, and a 15.4% peak demand reduction at an Australian shopping centre, each confirmed in the building's own data.
What results do building analytics platforms actually deliver?
Most of the value comes from operational corrections rather than capital works: schedules restored, deadbands widened, lockouts made to engage, sensors relocated and valves freed. Documented CIM results range from an 88% cut in winter chiller runtime to $41,000 a year in avoided water costs from a single leak.
What building analytics software do major property groups use?
Large owners and managers use building analytics to run portfolios consistently rather than site by site. PEAK is deployed across portfolios including QIC Global Real Estate's retail centres, Charter Hall's office portfolio, LaSalle and Kyko Group, alongside engineering partners who deliver it to their own clients.
How quickly can a building analytics platform deliver results?
Faster than most teams expect, because the first findings come from data the building is already producing. Eagle Street Partners was live 16 days from signature in Glasgow, Hoffman completed onboarding of a 180,000 sq ft site in under 20 days, and a Canary Wharf team verified a live fault 98 minutes into their first session.
Can fault detection save water as well as energy?
Yes, and it is often the fastest payback in year one. A leak runs continuously and rarely triggers any alarm. PEAK has detected leaks running at 2,000 litres an hour during a holiday shutdown, saving $41,000 a year and protecting a 4.0 star NABERS Water rating that would otherwise have fallen to 2.5.
Does building analytics work if the BMS front end is down?
It should, and that is a useful test when evaluating platforms. Monitoring that depends on the site's own front end loses visibility exactly when it is most needed. PEAK flagged a failed school chiller on a morning when the district's BMS front end was offline, and the fix was made before classes were affected.
How do engineering firms make money from building analytics?
By adding a recurring, technology-based service alongside project work and covering more buildings per engineer. Aero Performance Group grew its active project portfolio 50% without additional resourcing and verifies around 6 million kWh of utility incentives a year, while CSR Sustain runs its own analytics service in the UK.

Explore our comprehensive guide designed to help asset managers capture significant operational savings across commercial portfolios. Learn actionable, cost-cutting strategies using smart technology to boost efficiency, protect asset values, and enhance sustainability.
Automated PEAK alerts enabled faster AHU repair with minimal disruption
Read the story →