Energy management that finds waste at the equipment, not on the bill
Your bill tells you how much. It never tells you why.
Most energy programmes work from monthly consumption data - which arrives weeks late, aggregates the whole site, and shows a number rather than a cause. By the time a spike is visible on a bill, it has usually been running for a month.
A programming glitch left a chilled water plant running all weekend, drawing 20 kW an hour.
PEAK caught it. The correction was worth around 10% of the building's annual energy use - and no one would have seen it on a monthly bill.

Plant running out of hours
Equipment left on overnight, at weekends, or in unoccupied zones. The single most common source of avoidable consumption in commercial buildings.

Drift after tuning
Performance decays after every optimisation project. Without continuous monitoring, savings quietly erode until the next audit finds them gone.

Overrides left in place
A manual override set during a heatwave or a complaint, never reversed. Small changes to setpoints and schedules compound across a portfolio.

Faults nobody can see
A failing sensor, a stuck valve, simultaneous heating and cooling. The equipment appears to work; the meter tells a different story months later.
Energy savings are what fault detection pays for
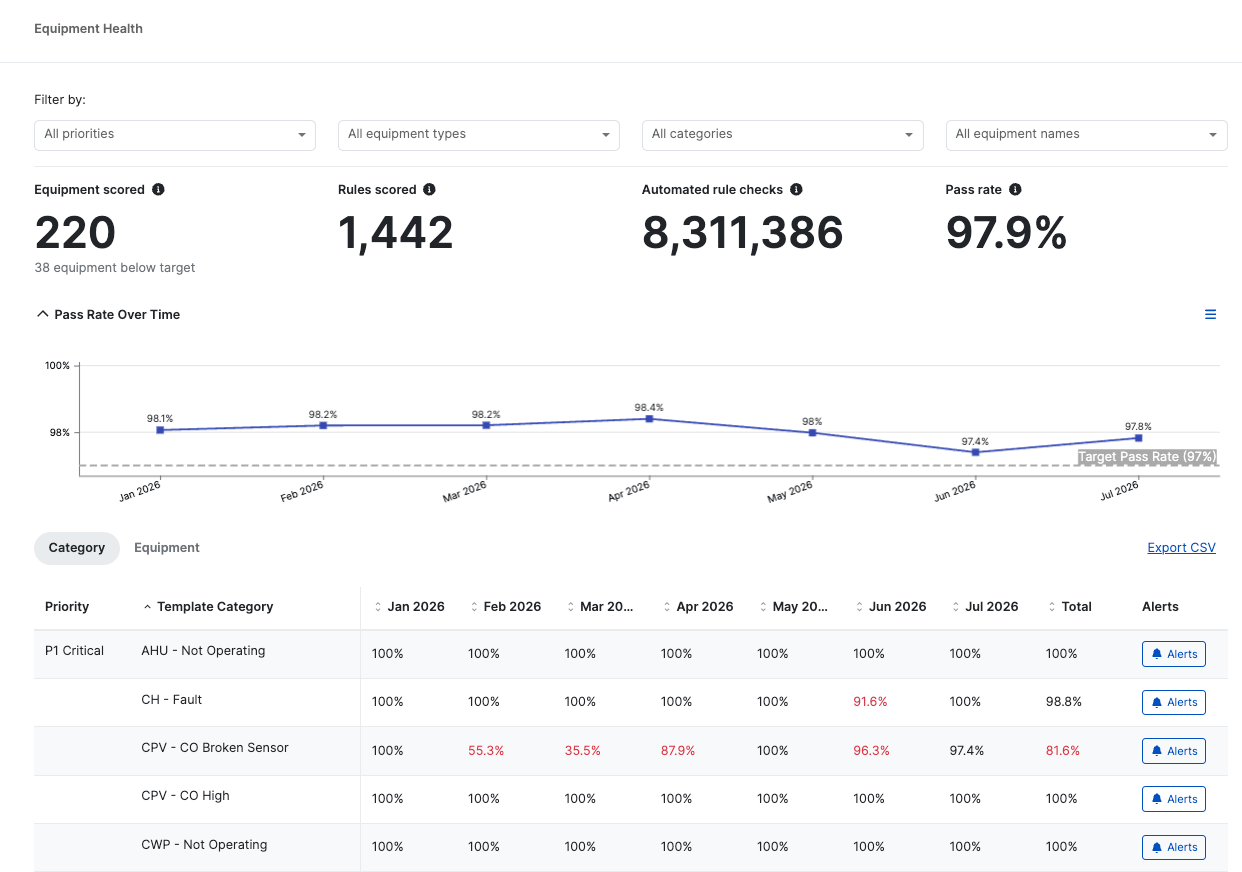
Energy efficiency is not a separate system bolted onto a building. It is the outcome of finding faults and making sure they get fixed. PEAK's fault detection engine reads your BMS, meters and sensors continuously, and every energy result on this page came out of that loop.
Detect the waste
Faults surface at equipment level the day they start, ranked by what they are costing you.

Fix it, on the record
Work is assigned, tracked and chased. Nothing sits in a report waiting for someone to notice.

Verify the saving held
Consumption is checked after the fix. If it drifts back, the fault reopens rather than disappearing.
Energy results our clients can point at
Charter Hall: energy saved across a 58-site office portfolio since 2019
Equivalent to around 12,000 tonnes of CO2 avoided across 1.45 million square metres. Charter Hall attributes the reduction to platform-led efficiencies alongside lower pandemic-era occupancy. Case study, November 2022.
Read the case study →Life sciences campus: 4 GWh and 1,200 tonnes of CO2e
Return on investment inside twelve months, across a complex site with limited connectivity and stalled efficiency initiatives.
Read the case study →An energy spike stopped before it took hold
Real-time detection flagged manual overrides instantly - drift caught at the start rather than at the quarterly review.
Read the story →Overnight operation, leaks, billing errors and sensor drift
Dozens of documented wins across office, retail, airport and university portfolios.
Browse all success stories →BMS, energy management system, or analytics?
An energy management system (EMS) collects consumption data from utility meters and sub-meters and reports on it. A building management system (BMS) runs the plant. Neither is designed to explain why consumption changed, or to make sure someone fixes it.
The three layers do different jobs, and most portfolios need all three.
Operates the plant in real time
What equipment is doing right now, and when a threshold is breached
Analyse its own performance, or tell you whether that behaviour is efficient
Collects and reports consumption
How much energy was used, by meter and by period, against tariffs and targets
Attribute consumption to the equipment or the fault causing it
Explains consumption and closes the work
Which unit is wasting energy, what it is costing, who needs to fix it, and whether consumption actually fell
The data your BMS and meters already produce - no rip-and-replace
What the research says about building energy
of total energy use in a typical commercial building comes from HVAC - which is why fault detection on HVAC plant moves the bill fastest.
US Energy Information Administration.
median whole-building energy saving from fault detection and diagnostics software, with potential of 5-30%.
US Department of Energy, Better Buildings: Building Fault Detection and Diagnostics.
savings on energy bills from operations and maintenance programmes targeting efficiency, without significant capital investment.
US Department of Energy, Federal Energy Management Program.
What energy management on PEAK changes

Energy cost
Waste is found at the equipment that causes it, so reductions come from operations rather than capital spend.

Carbon emissions
Lower consumption feeds directly into emissions reporting, net zero commitments and green lease obligations.

Ratings performance
NABERS, GRESB and equivalent ratings are won through the operating year, not in the assessment week.

Tenant comfort
Savings are made without pushing conditions outside comfort bands, because zone conditions are monitored alongside consumption.

Portfolio benchmarking
Compare buildings against targets, baselines and each other - so effort goes where the gap is largest.

Capital decisions
Evidence of how equipment actually performs, so replacement and upgrade cases rest on data rather than age.
Unlocking Operational Savings Across a Commercial Portfolio
For asset managers looking to capture operational savings without waiting for a capital programme.
Building energy management, explained
What is building energy management software?
Software that monitors how a building consumes energy, identifies where it is being wasted, and supports the work required to reduce it. Unlike a metering or reporting tool, it links consumption back to the equipment and operating decisions causing it.
How is this different from an energy monitoring dashboard?
A dashboard shows consumption. PEAK explains it: which unit is running out of hours, which valve is stuck, what it is costing, who needs to fix it, and whether consumption actually fell afterwards.
Do we need to replace our BMS or install new meters?
No. PEAK is BMS-agnostic and works with the meters, sensors and equipment data already in place, including legacy systems.
Will cutting energy affect tenant comfort?
It should not. PEAK monitors thermal comfort and indoor conditions alongside consumption, so waste is removed without pushing zones outside acceptable ranges - and comfort issues are themselves flagged as faults.
How does energy management relate to fault detection?
Most avoidable energy consumption is caused by a fault: equipment running when it should not, a failed sensor, a control override. Fault detection is the mechanism; lower energy cost is one of the outcomes it produces.
Powering property teams in these world leading companies.