Data-driven maintenance: service what needs it, not what's scheduled
You are paying to inspect equipment that is working fine
Most maintenance contracts run on planned preventive schedules, unplanned reactive callouts, or both. Neither is driven by what the equipment is actually doing.
Planned preventive (PPM)
Rigidly scheduled checks. Time and money spent inspecting plant that is running perfectly well, on a calendar written before anyone looked at the data.
Unplanned reactive (UPM)
The absence of a strategy. Work happens when something breaks or a tenant complains, which makes budgeting a guess and disruption routine.

Missed issues
While a contractor inspects working equipment, genuine faults elsewhere can sit unaddressed for months - quietly degrading efficiency until they become a failure or a tenant complaint.

Misaligned objectives
Traditional routines were not designed around what asset managers are judged on today - tenants, sustainability and cost - so they can jeopardise all three at once.
What PEAK does in a data-driven maintenance programme
Data-driven maintenance uses live equipment data to decide what gets serviced, when, and in what order - instead of a calendar deciding for you. It covers what the industry calls predictive maintenance, and goes further: the same data that predicts a failure also assigns the work and proves it was done.

PEAK reads your equipment continuously
PEAK connects to your existing BMS, meters and sensors and analyses millions of data points as they arrive - so a dip in performance is visible the day it starts, not at the next scheduled inspection.

PEAK predicts what needs attention next
The Rules Engine flags equipment drifting away from expected performance before it fails. Reactive work still happens - but it is triggered by the data, not by a tenant complaint.

PEAK ranks the work by what it costs you
Every fault is scored on energy cost, comfort impact and equipment risk, so your team and your contractors work the most consequential issues first rather than the next item on a list.

PEAK closes the job out and proves it
Work is assigned to a named person, chased when it goes overdue, and checked against the equipment data afterwards. If the fix did not hold, PEAK reopens it.
Your contractors stop marking their own homework
Most maintenance reporting comes from the people being paid to do the maintenance. PEAK gives you an independent record: what was raised, who it went to, how long it sat, and whether the equipment actually recovered afterwards.
Performance against KPIs
Contractor performance measured against agreed standards, on data neither party can edit.
Full task oversight
Every assigned task tracked in real time - raised, in progress, overdue, closed.
Verified, not assumed
The equipment data confirms the fix held. Work that didn't land gets reopened.
What data-driven maintenance changes

Maintenance contracts
Fewer reactive callouts and a tighter focus on real issues change what you are buying - and what it should cost.

Equipment downtime
Continuous monitoring and automated fault detection catch issues before building users feel them.

Equipment life
Timely intervention mitigates wear, so plant runs properly for longer and capital replacement moves out.

Sustainability performance
Better-run equipment uses less electricity, gas and water - feeding ratings, net zero targets and green lease commitments.

Team productivity
Fewer wasted onsite hours, root causes addressed directly, and issues resolved centrally rather than building by building.

Tenant experience
Fewer disruptions and steadier conditions across all zones, because problems are found before they are reported.
What the evidence says about maintenance
of air handling units are carrying a fault on any given day - which is the work a calendar-based schedule is not looking for.
Lawrence Berkeley National Laboratory, analysis of 60,000+ pieces of HVAC equipment.
savings on energy bills from operations and maintenance programmes targeting efficiency, without significant capital investment.
US Department of Energy, Federal Energy Management Program, O&M Best Practices Guide.
monthly completion standard on P1 and P2 actions across PEAK portfolios - the measure most maintenance reporting never states.
CIM operating standard, measured on platform data.
Reactive, preventive, predictive, data-driven
Four ways to decide what gets maintained. They differ in one respect above all: what triggers the work.
Something breaks, or a tenant complains
None
Budgets are unpredictable and disruption is routine
The calendar
An asset register and a schedule
You inspect healthy plant while faults elsewhere run for months
A forecast that equipment is heading for failure
Live equipment data and fault analytics
Predicts well, but nothing guarantees the work gets done
Measured condition, ranked by business impact
The same, plus assignment, tracking and verification
It doesn't, if the loop is genuinely closed and verified
Predictive maintenance is the forecast. Someone still has to do the work.
Predictive maintenance uses live equipment data to anticipate failures before they happen, so plant is serviced on evidence of deteriorating condition rather than on a fixed schedule. It is the forecasting half of data-driven maintenance, and PEAK does it: continuous analysis of BMS, meter and sensor data flags equipment drifting away from expected performance, well before it fails outright.
The half that gets skipped is what happens next. A prediction that nobody is assigned to act on changes nothing about the building. That is why the loop on this page runs past the forecast into assignment, escalation and verification.

Planned preventive maintenance (PPM)
Servicing carried out to a fixed schedule, regardless of equipment condition - quarterly inspections, annual services, routine filter changes. Statutory and safety-critical work stays here for good reason.

Unplanned maintenance (UPM)
Reactive work triggered by a breakdown or a complaint, with no ongoing strategy behind it. It is the most expensive way to run plant and the hardest to budget for.
How the transition actually happens
This is a contract change as much as a technology change. It runs in three stages, usually across renewal cycles rather than overnight.
Initial integration
Analytics goes in alongside the existing contract. It adds cost at first, and it produces the evidence of what the building actually needs.

Contract evolution
The maintenance contract is rewritten around condition rather than schedule. Analytics moves inside the core contract; routine servicing costs come down.

Mastery and refinement
Condition-based maintenance becomes the operating norm. Backlogs clear, equipment lasts longer, and costs settle lower than where you started.
Teams who stopped servicing to a calendar

Scheduled maintenance checks are now a thing of the past.
"Scheduled maintenance checks and servicing is now a thing of the past as the data helps us determine precisely when and where maintenance is needed. We can now actively anticipate and prevent equipment breakdowns which means equipment is more likely to last its specified lifespan and we don't have to resort to costly fixes or replacements."

It goes one step further than simply delivering data and analytics.
"The platform goes one step further than simply delivering data and analytics; it supplies the insights and central intelligence required to manage our portfolio sustainably and efficiently. This elevates the resilience and long-term viability of our assets, accelerating our approach to addressing climate change and unlocking environmental value."

Improving our operations through data-driven decisions.
"Brisbane Airport Corporation was pleased to engage CIM to assist with delivering energy savings, optimising building performance and improving our operations through data-driven decisions."
It finds what's broken and guides better maintenance man-hours.
"We want maintenance time to be better spent in a more productive fashion. It's impossible to check every sensor and every actuator every month. We want our BMS and Mech to investigate real alerts. That's where analytics like CIM have helped. It finds what's broken and guides better maintenance man-hours."
Fault detection is the engine. Maintenance is what it drives.
Fault detection and diagnostics sits inside data-driven maintenance. FDD finds and diagnoses what is wrong; data-driven maintenance is the operating model that decides what gets done about it, by whom, and in what order.
Decides what gets maintained, when, by whom, and how it is paid for.
You can have FDD without data-driven maintenance. Most organisations do: the platform runs, the faults are found, and the contract keeps billing for the same calendar inspections.
A Guide to Data-Driven Property Maintenance
The practical playbook for moving a portfolio off calendar-based servicing - and rewriting the contract that goes with it.
Data-driven maintenance, explained
What is data-driven maintenance?
Maintenance decided by the condition of the equipment rather than by a fixed schedule. Live data from plant and equipment determines what needs attention, when, and in what priority order.
How is it different from predictive maintenance?
Predictive maintenance is the forecasting part - using data to anticipate failure. Data-driven maintenance includes that, and adds the operating model around it: prioritising the work, assigning it, tracking it and verifying the equipment recovered.
Does it replace planned preventive maintenance entirely?
No. Statutory and safety-critical servicing still runs to schedule. What changes is the discretionary work: routine checks on equipment that is running well get replaced by attention to equipment that is not.
What happens to our existing maintenance contract?
It typically changes at renewal rather than immediately. Analytics runs alongside the current contract first, then the scope is renegotiated once there is evidence of what the building actually needs.
Do we need new sensors?
Usually not. Most buildings already produce far more data than anyone reads. PEAK is BMS-agnostic and works with the meters, sensors and equipment feeds already in place.
How does it hold contractors accountable?
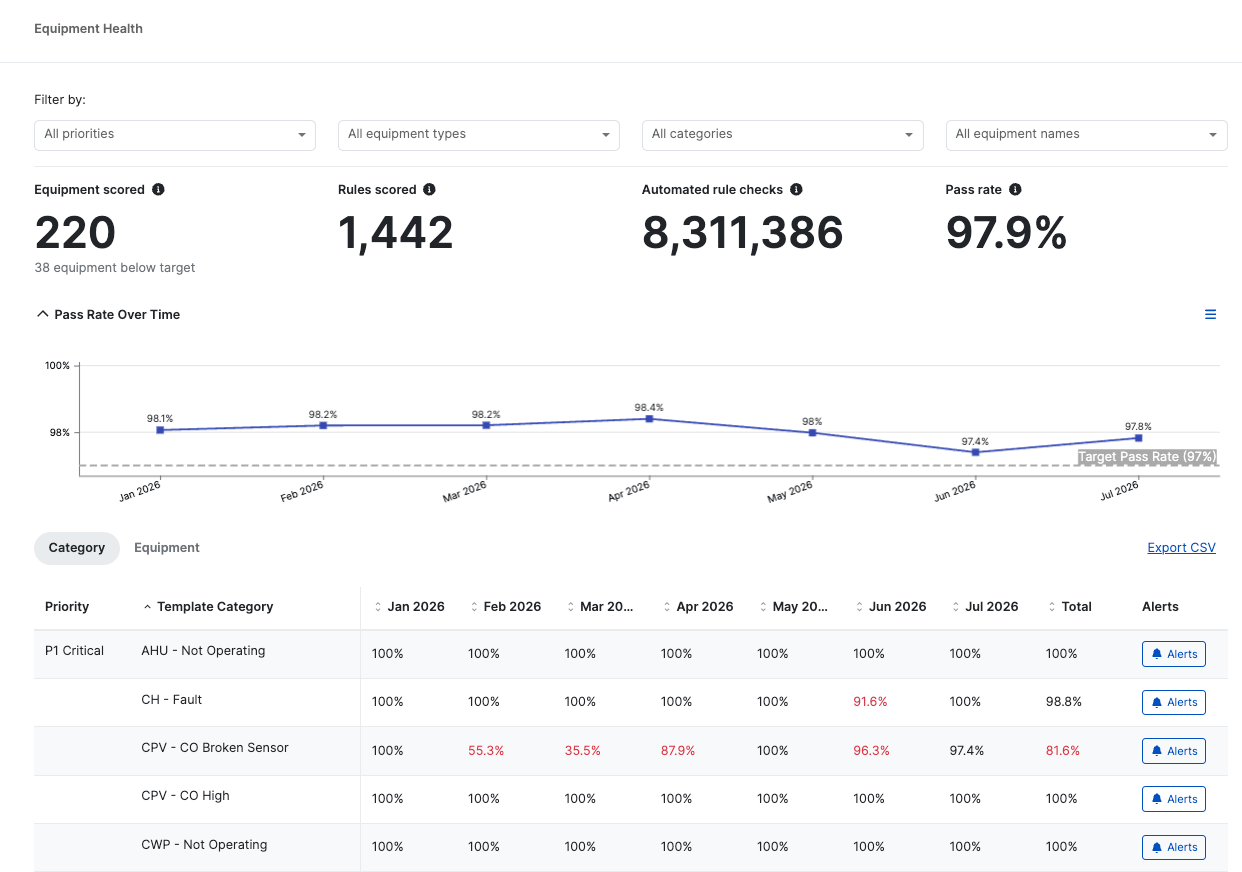
Every raised issue is tracked from detection to close-out on data the contractor does not control, and the equipment data confirms whether the fix held. Performance can be measured against agreed KPIs rather than self-reported completion.
Works with your existing BMS
Condition-based maintenance starts with the data your building already produces. PEAK reads Trend, Tridium Niagara, Schneider Electric, Honeywell, Siemens, Johnson Controls, Distech Controls, Delta Controls, Alerton and Automated Logic systems through BACnet/IP, routed BACnet MS/TP, a vendor API or scheduled CSV exports, without a rip-and-replace of your existing controls.
See how PEAK connects to your BMSPowering property teams in these world leading companies.