Most maintenance contracts are still written around a calendar. A set number of visits, a list of tasks per visit, a response time for call-outs, and an annual fee. That structure made sense when nobody could see what the plant was doing between visits. Once a contractor has fault detection running across a client's buildings, it stops making sense, because the data shows exactly which equipment needs attention, which fixes held and what each one was worth.
This guide is for BMS, controls, HVAC and facilities contractors, and the engineering firms that work alongside them, who want to turn that data into a better contract. It covers what an analytics-backed maintenance contract is, how it differs from a traditional PPM contract, the service tiers that work, a KPI schedule you can adapt, the main pricing models and how to build a retainer price, the clauses that prevent disputes, and how partners on the PEAK Platform are moving clients across. It includes templates throughout.
Key takeaways
- Scope, priorities and payment follow the data. An analytics-backed contract still covers compliance, but directs effort to the faults that matter and pays for verified outcomes.
- Tier the offer. Essential, Performance and Optimisation tiers let clients start small and step up as the evidence builds.
- Baseline before targets. Set KPI targets after 60 to 90 days of data, never before.
- Combine pricing models. Most contracts work best with a monitoring retainer, a schedule of rates for remedials and a small KPI-linked element.
- Write the dispute-prone clauses first: data access, independent verification, overrides, remedials approval and exit.
What is an analytics-backed maintenance contract?
An analytics-backed maintenance contract is a building services maintenance agreement in which scope, priorities and payment are tied to continuous building data rather than only to a schedule of visits. Fault detection decides what gets attention, fixes are verified in the data, and the contractor reports outcomes such as energy, reliability and comfort, not just tasks completed.
It does not replace planned maintenance. Statutory and safety tasks, and the planned preventive maintenance set out in specifications such as SFG20 in the UK or ANSI/ASHRAE/ACCA Standard 180 in the US, still sit underneath. What changes is everything above that floor: which faults are worked first, how a fix is proven, and what the client pays for. Some owners call it data-driven maintenance, others performance-based maintenance. The structure is the same.
How is it different from a traditional PPM contract?
A traditional PPM contract pays for visits and tasks on a fixed calendar and measures the contractor on completion and response times. An analytics-backed contract keeps compliance tasks but directs effort to faults found in the data, verifies each fix, reports outcomes monthly and links part of the payment to measured performance.
Scroll sideways to see all columns.
| Compared | Traditional PPM contract | Analytics-backed contract |
|---|---|---|
| What drives scope | Asset list and task schedule | Task schedule plus faults found in the data, ranked by cost and risk |
| Visits | Fixed frequency, whatever the plant is doing | Compliance visits fixed; other visits targeted at live faults |
| How a job is closed | Technician signs it off | Closed when the fault clears in the data across a full operating cycle |
| Reporting | Service sheets and completion rates | Monthly one-page outcome report and quarterly review |
| KPIs | PPM completion, attendance times | Time to verified fix, repeat faults, overrides released, energy |
| Remedial works | Quoted job by job, often disputed | Register separating in-scope from chargeable, priced from agreed rates |
| Payment | Fixed annual fee | Retainer plus rates, with a performance-linked element |
WA BMS Controls, which joined the PEAK partner community in Western Australia this year, describes the shift well: moving clients away from a broad, scheduled maintenance approach towards surfacing the critical and time-sensitive issues, so problems are caught while they are still manageable. That is the core of the contract change. The calendar stays for compliance; the data decides everything else.
Which service tiers work for analytics-backed maintenance?
Three tiers cover most clients. Essential adds data-led prioritisation to compliant PPM. Performance adds verified fixes, a monthly outcome report and KPI-linked payment. Optimisation adds continuous fault-led tuning with savings measured against a baseline. Each tier includes the one before, so clients can start small and step up as evidence builds.

Scroll sideways to compare all three tiers.
| Tier 1EssentialCompliant maintenance, prioritised by data | Tier 2PerformanceOutcomes reported and verified | Tier 3OptimisationContinuous tuning, savings measured | |
|---|---|---|---|
| What's included | Statutory and planned maintenanceReactive call-outsFault list ranked by cost and risk to direct visits | + Everything in EssentialFixes verified in the dataRemedials registerMonthly one-page value reportQuarterly review | + Everything in PerformanceContinuous fault-led tuningEnergy and runtime targetsSavings measured against a baseline |
| KPIs | PPM completionAttendance and response times | Time to verified fixRepeat faultsOverrides releasedAgeing of open actions | Weather-normalised energyOut-of-hours runtimeVerified savings |
| Payment basis | Fixed fee per building, plus a schedule of rates for remedials | Retainer, with a small share of the fee linked to KPIs | Retainer plus shared savings or utility incentives |
| Good fit for | Clients new to analytics, or portfolios where compliance is the priority | Owners who want proof of what they pay for, and most renewals | Owners with net zero, rating or building performance standard targets |
Partners rarely sell all three on day one. The Performance tier is the usual entry point for an existing client, because it turns work the contractor is already doing into evidence the owner can see. Optimisation follows once a baseline exists and the owner trusts the numbers.
Which KPIs and SLAs belong in the contract?
Put outcome KPIs in the contract, not just activity measures: time to verified fix by priority, verified closure rate, repeat faults within 90 days, overrides released at the end of each visit, open actions older than 90 days with a named owner, and, for the Optimisation tier, weather-normalised energy. Define each one precisely and set targets only after a baseline period.
Use the template below as a starting point for the KPI schedule. The targets are deliberately left open: they should come from the first 60 to 90 days of data on that building, agreed by both parties, rather than from a number written into a tender before anyone has looked at the plant.
Illustrative template. Adapt priority definitions, measurement rules and payment links to each contract.
Two of these KPIs matter more than they look. Across CIM's portfolio, about 1 in 25 action tickets concern an override left in place after a visit, and 56% of open remedial actions were older than 90 days at the last count, as we set out in how to verify a contractor actually fixed an HVAC fault. Contracts that measure both see both improve. For the KPIs to report to the owner each month, and how to present them, see how BMS and HVAC contractors prove the value of their maintenance work.
KPIs only change behaviour if someone looks at them. At one large Australian shopping centre, monthly governance emails summarising open priority 1 and 2 actions prompted the site team to push for close-out, and the mechanical contractor acknowledged the list and began picking items up quickly. The KPI schedule is the contract; the review cadence is what makes it work.
Which pricing models work for analytics-backed maintenance?
Six pricing models are common: a fixed fee per building, a fee per asset or data point, a retainer with a schedule of rates for remedials, a KPI-linked bonus and malus, shared savings, and incentive-funded work. Each shifts more performance risk to the contractor. Most contracts combine two or three, for example a monitoring retainer, a schedule of rates and a small KPI-linked element.
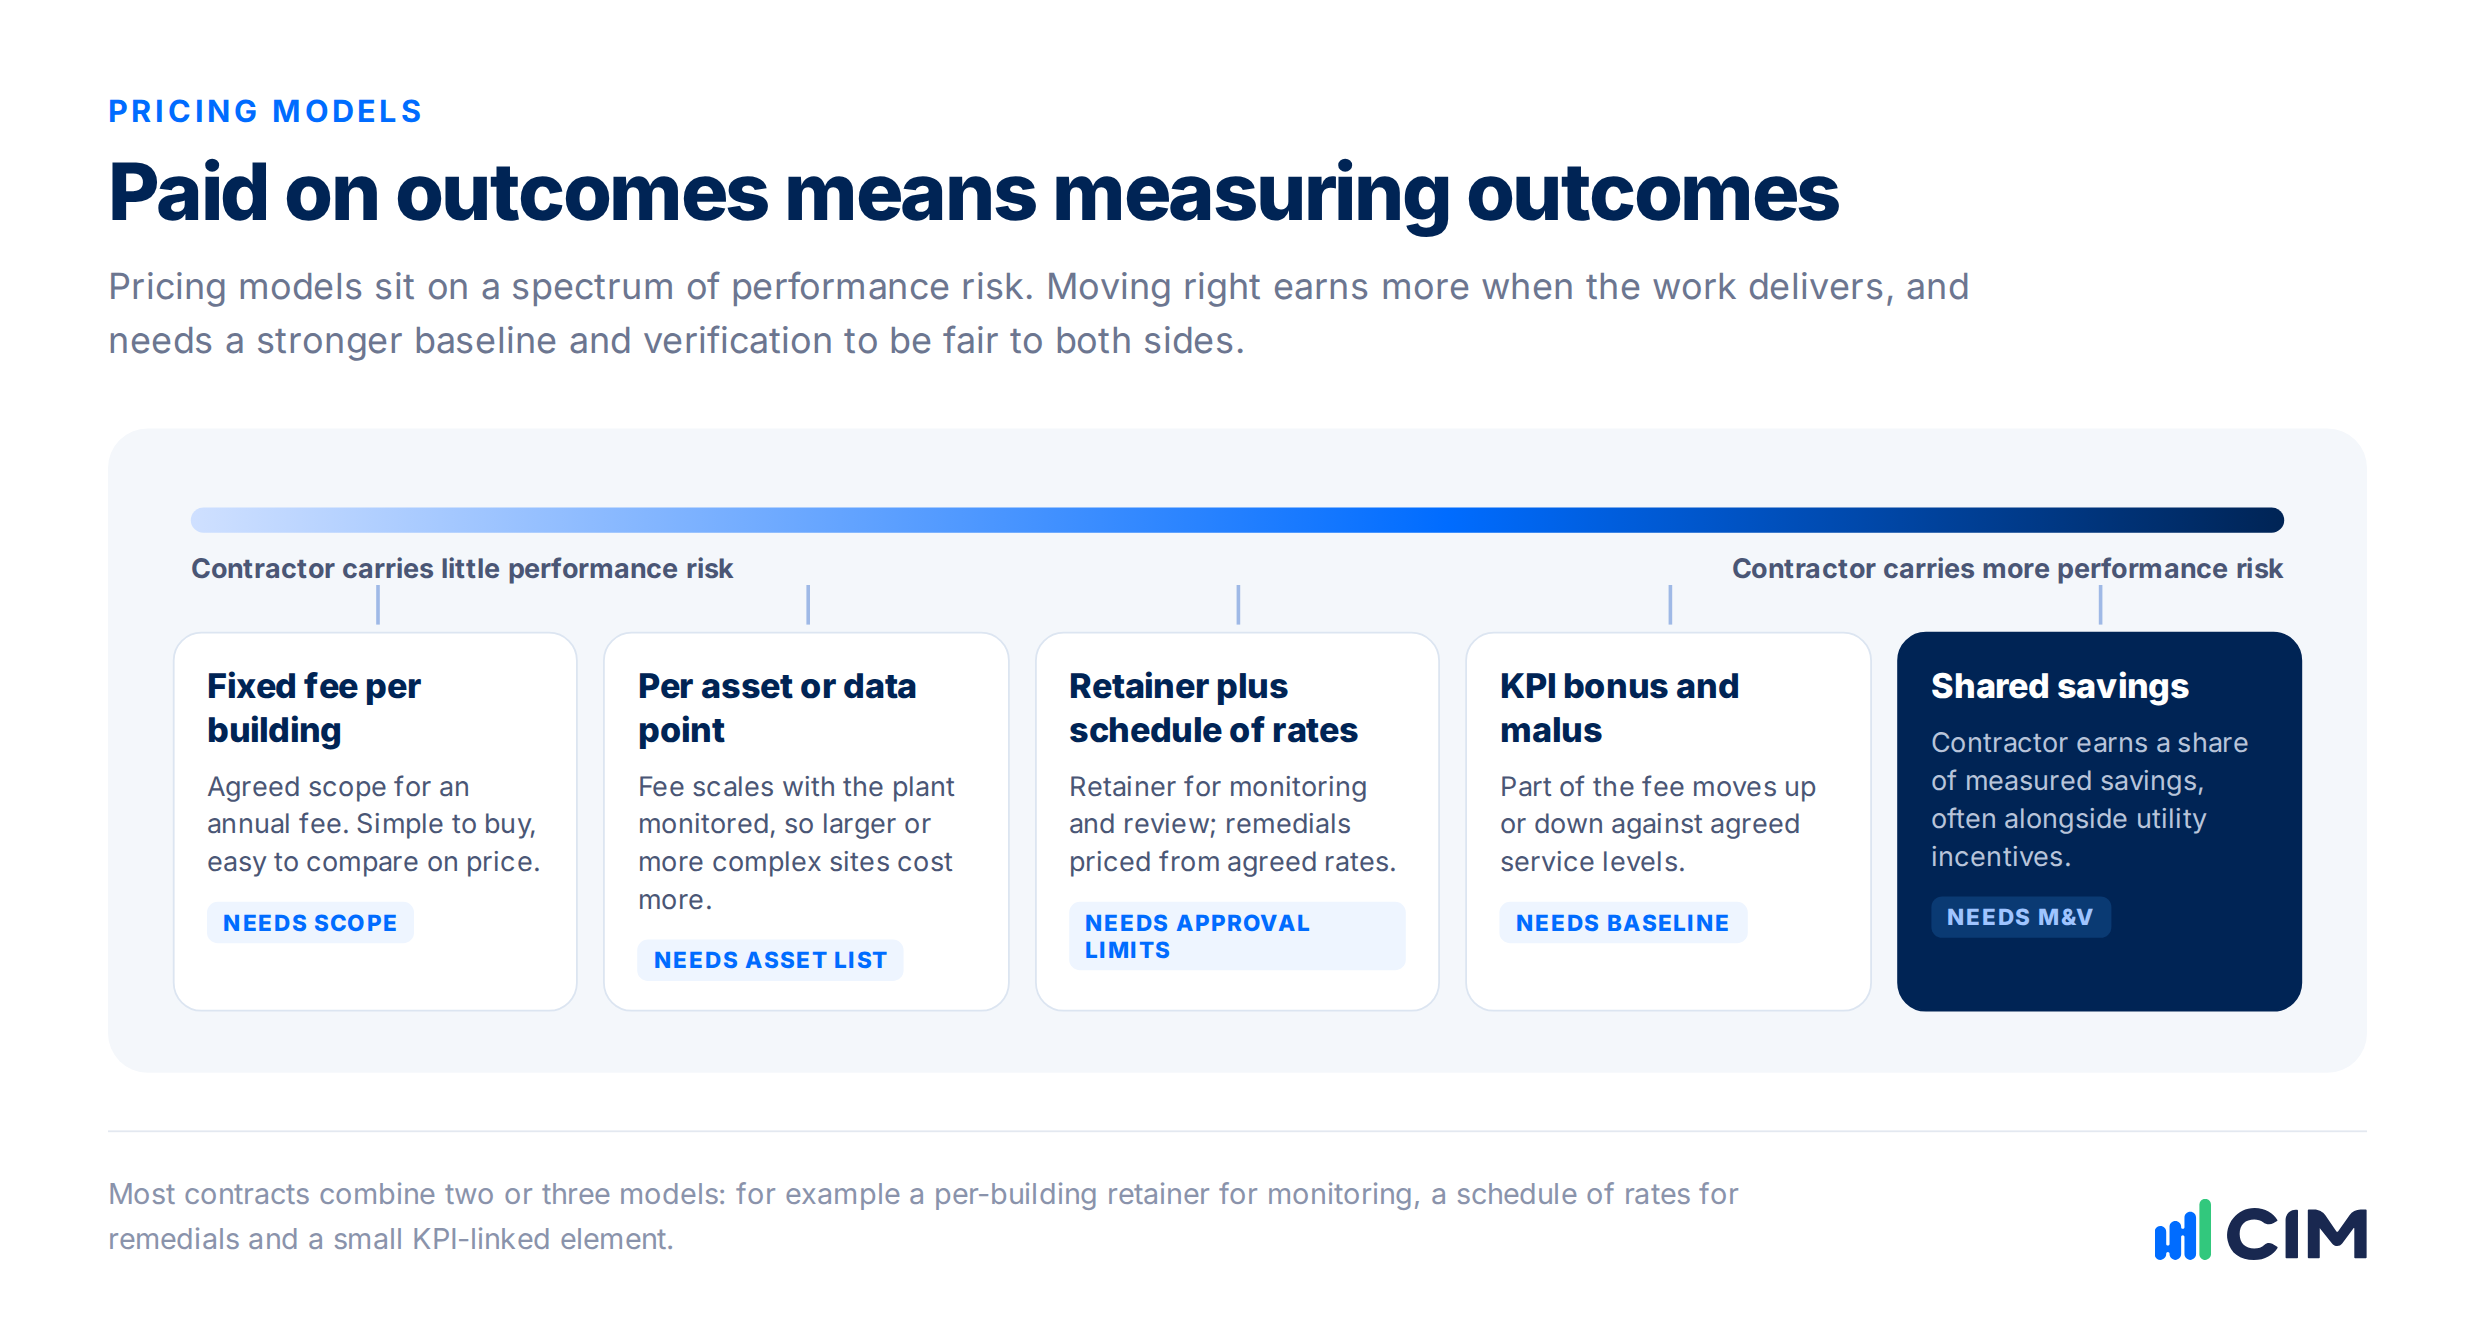
Risk shown is the performance risk carried by the contractor. Most contracts combine two or three models.
The UK's NEC4 facilities management contract shows the KPI-linked approach is now standard practice. Its Performance Table sets service targets and adjusts payment up or down when measured performance is better or worse, and reactive work is called off against a price list. An analytics-backed contract simply gives that table better data.
Shared savings deserve particular care. They work well in the Optimisation tier, where metering, a weather-normalised baseline and agreed adjustment rules exist. Without those, the conversation at year end becomes an argument about the baseline rather than a payment. The US Department of Energy's FEMP M&V Guidelines (version 5.0), written for performance-based contracts including improved operation and maintenance, are a sound reference for both parties. Our guide to measurement and verification explains the options.
Incentive funding can change the economics entirely in the US. Aero Performance Group, a Chicago-area retro-commissioning and MBCx provider, verifies around 6 million kWh of energy-saving incentives a year for its clients on PEAK, and has grown its active project portfolio by 50% without adding resources.
How do you build a retainer price?
Build a retainer bottom-up from seven components: platform licence, onboarding, engineer review time, site attendance, reporting and reviews, a contingency for data and access issues, and margin. Price remedial works separately from agreed rates. The largest variable is engineer review time, which falls sharply once fault rules are tuned to the building.
A pricing method, not a price. Build each component from your own costs and the client's portfolio.
Onboarding is where retainers quietly lose money. ADG Energy, a US partner rolling PEAK out across a school district portfolio in phases, provides equipment lists with levels and zones for each site before integration starts, so on-site technicians can find the exact plant a fault refers to. Time spent on that list at the start saves far more in wasted site visits later.
Platform cost is the simplest line to model. CIM licenses PEAK to engineering and service partners per data point, so it scales with the size and complexity of each client's building and can be built straight into a per-building or per-point price. Direct customers are licensed per square metre of floor area.
How should remedial works be handled in the contract?
Keep remedial works out of the retainer. Agree a register that classifies each fault as in-scope PPM work or chargeable remedial work, price chargeable items from a pre-agreed schedule of rates, set approval limits above which the owner must sign off, and invoice only after the fix is verified in the data.
This is where most maintenance disputes start, and where data helps most. A fault with its evidence, its classification and its verified status is hard to argue with. Our guide to costing remedial works from fault detection sets out how to separate PPM-scope work from chargeable work and price each item. Under the NEC4 model, chargeable reactive items map naturally to Service Orders called off against the price list.
Which clauses should an analytics-backed maintenance contract include?
Seven clauses prevent most disputes: data access and ownership, independent verification of fixes, an override release rule, baseline and normalisation, remedial works approval, a governance and review cadence, and data portability at exit. Write them before the commercial terms, because each one changes how the price is built.
The starting points below are illustrative wording to adapt with your own legal adviser. They are not legal advice.
The exit clause protects the client and, less obviously, the good contractor too: a provider confident in its record has nothing to lose from making it portable, and owners notice who offers it.
How do you move an existing client to an analytics-backed contract?
Move an existing client at renewal, not mid-term. Start monitoring one or two buildings three to six months before the contract ends, use the data to establish a baseline and fix the highest-value faults, then propose the Performance tier with KPI targets drawn from that baseline. Expand to the rest of the portfolio once the first sites prove the model.
Partners use the first stage in different ways. Hoffman Building Technologies deployed PEAK on its own 180,000 sq ft Charlotte headquarters first, delivering a 58% reduction in fan power on one air handling unit, and now opens prospect conversations with a working showcase rather than a slide, as described in the Hoffman case study. ADG Energy often starts with a recommissioning project as the first step towards ongoing monitoring. Its response value is already on the record: when a school's own building automation front-end went down, PEAK still flagged a failed chiller and ADG Energy had a technician dispatched before classrooms lost cooling.
In Australia, mechanical contractor Automated Air combines its HVAC expertise with PEAK as a building intelligence offer and runs pilot deployments on key projects before expanding. In the US, an energy and sustainability consultancy that started with a single arts centre client is now folding PEAK into its standard building optimisation offering, after the client's team found it delivered far more than traditional retro-commissioning for the money. The pattern is the same everywhere: prove it on a few buildings, then let the evidence sell the tier.
The Optimisation tier is where the numbers become hardest to ignore. At a London headquarters run by an FM provider, electricity use fell 14% in 11 weeks after PEAK went live, measured against the same weeks of the previous year, as set out in this success story.
Where does CIM's PEAK Platform fit?
More than 20 engineering and service partners use CIM's PEAK Platform to deliver analytics-backed maintenance, retro-commissioning and monitoring-based commissioning across more than 700 commercial buildings. PEAK reads the existing BMS across all major brands without new hardware, ranks faults by cost and comfort impact, routes them to the right contractor and confirms in the data that each fix held. The KPI schedule, the remedials register and the monthly owner report in this guide all draw on that same record.
For the commercial case behind tiered, outcome-based contracts, see our Partner Value Series on revenue and retention. For delivery, read how engineering firms run RCx, MBCx and data-driven maintenance on FDD, and see how PEAK supports data-driven maintenance.
Build your next contract on evidence
Talk to our partner team about structuring tiers, KPIs and pricing around PEAK, and about how other partners have made the move.
Talk to our partner teamWatch a partner demoFrequently asked questions
What is a data-driven maintenance contract?
A data-driven maintenance contract is a building services maintenance agreement in which scope, priorities and payment are tied to continuous building data. Planned and statutory maintenance continues, but fault detection decides what is worked first, fixes are verified in the data and the contractor reports outcomes such as energy, reliability and comfort.
What should be included in an analytics-backed maintenance contract?
Include a defined service tier, a KPI schedule with precise definitions, a baseline period before targets are set, a pricing model, a remedials register with a schedule of rates and approval limits, and clauses on data access, independent verification, override release, governance reviews and data portability at exit.
How do you price a building maintenance retainer?
Build it bottom-up from the platform licence, onboarding, engineer review time, site attendance, reporting and reviews, and a contingency for data and access issues, then add margin. Price remedial works separately from a schedule of rates. Engineer review time is the largest variable and falls once fault rules are tuned.
What KPIs should a maintenance contract include?
Use outcome KPIs: attendance time for critical faults, time to verified fix, verified closure rate, repeat faults within 90 days, overrides released at the end of each visit, ageing of open actions, and weather-normalised energy for optimisation contracts. Set targets after a 60 to 90 day baseline.
What is a performance-based maintenance contract?
A performance-based maintenance contract links part of the contractor's payment to measured service levels or outcomes rather than to visits alone. The UK's NEC4 facilities management contract does this through a Performance Table that adjusts payment up or down against agreed targets.
Should maintenance contractors share energy savings with building owners?
Shared savings can work well for optimisation contracts where metering, a weather-normalised baseline and agreed adjustment rules are in place. Without proper measurement and verification they often lead to disputes, so most contractors combine a monitoring retainer with a modest KPI-linked element instead, or alongside.
Who owns the building data in a maintenance contract?
The building owner should own the building data. The contractor needs read access to deliver the service, and the contract should give the owner the fault, action and verification history at the end of the term in an agreed format, so records transfer to any incoming provider.
How do you move a client from PPM to an analytics-backed contract?
Start monitoring one or two buildings three to six months before renewal, use the data to set a baseline and fix the highest-value faults, then propose a Performance tier with KPI targets drawn from that baseline. Expand across the portfolio once the first sites prove the model.