Most building faults are quiet. A valve passes by a few percent, a schedule slips by an hour, a sensor stops moving. Nothing alarms, nobody complains, and the building carries on. The cost turns up months later on an energy bill that nobody can fully explain.
We wanted to know which of those quiet faults actually matter. So we went through every fault alert raised across our monitored portfolio over the last twelve months: more than 63,000 of them, across 600+ commercial buildings and over 100 million square feet. This is what is genuinely wrong with commercial buildings right now, ranked by how many buildings have it, and by what it costs when someone fixes it.
Key findings
- 85% of monitored buildings had plant fail to start at some point in the year, the most widespread fault of all.
- The median building carries seven distinct fault families at once. Roughly three quarters carry five or more.
- Valve faults are under 5% of alert volume and produced the two largest verified savings in the portfolio, at A$63,316 and A$56,117 a year from single air handling units.
- The most common faults are not the expensive ones. Four of the highest-value fault types sit among the least frequent.
- A large share of faults are human in origin: overrides left in place, setpoints changed for a complaint, schedules adjusted and never restored.
What counts as an HVAC fault
An HVAC fault is any condition where equipment or its controls behave differently from the way they were designed and commissioned to behave. That is a broader definition than most people expect, and deliberately so. It covers mechanical failure, but it also covers a valve that no longer seals, a schedule that no longer matches occupancy, a sensor that no longer reads true, and a control strategy that was switched off during a callout and never switched back.
A fault is not the same thing as an alarm. An alarm fires when one value crosses a threshold somebody configured. A fault is a pattern across several values over time. Almost every fault below stays within every configured threshold on every individual point, which is exactly why it never alarms and can run for years.
How common each fault is
Twenty-one fault families account for 95% of every alert raised. Below they are ranked by the share of buildings affected rather than by alert volume, because a single large portfolio can generate thousands of alerts of one type and distort the picture. The faults marked in red are the ones that also sit at the top of the savings chart further down.

Nearly every building in the portfolio had plant fail to start at some point in the year. More than three quarters are running equipment when the building is empty. More than three quarters have at least one sensor telling them something untrue. Most of these faults would not be found by a commissioning exercise either, because they appear long after handover.
Frequency is not the same as cost
Out-of-hours operation is the single most common fault we see, and most instances of it resolve for a few hundred dollars a year. Valve faults are less than a twentieth of our alert volume. They hold the top of the savings chart by a wide margin.
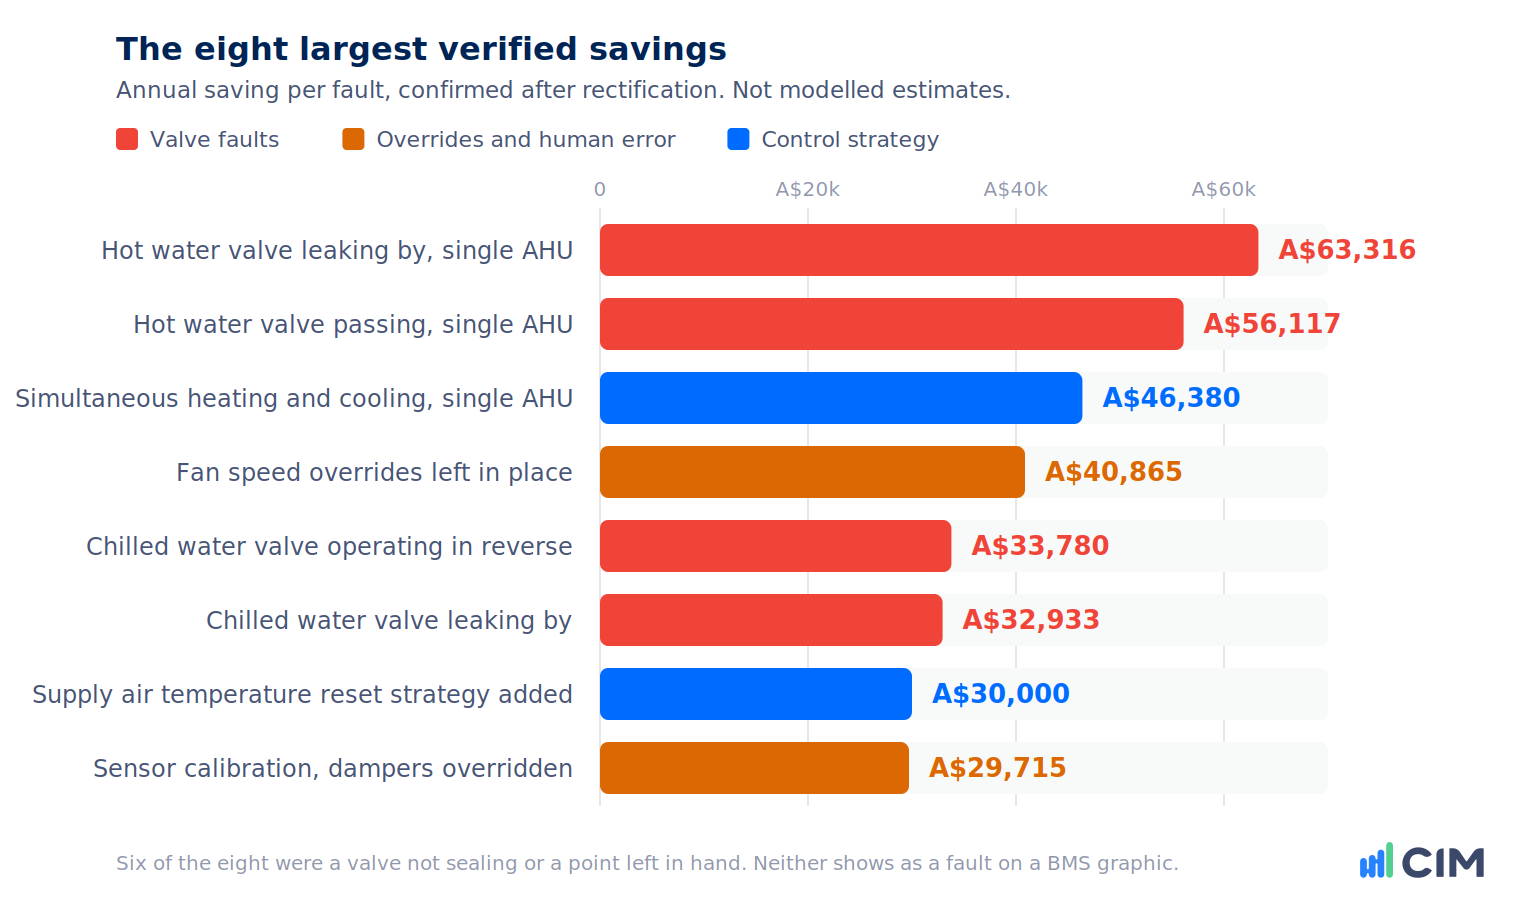
Every one of the largest savings came from a valve, an override, a missing control strategy, or a unit heating and cooling at the same time. None came from the high-frequency families. The faults that cost the most are the ones that hide behind a graphic that looks completely normal.
That pattern is consistent with the wider evidence base. Lawrence Berkeley National Laboratory's review of commissioning outcomes across roughly 1,500 North American buildings found a median simple payback of 1.7 years for existing-building commissioning, with a 25th to 75th percentile range of 0.8 to 3.5 years (Lin, Kramer and Granderson, 2020). The returns are real. Capturing them depends entirely on whether the findings get actioned and confirmed.
There is a reason the expensive faults hide. They cannot be confirmed from a screen. Somebody has to go and physically check.
The faults, one by one
Each entry shows the signature the fault leaves in the data. If you have a BMS with trending, you can look for these patterns yourself.
1. Out-of-hours operation
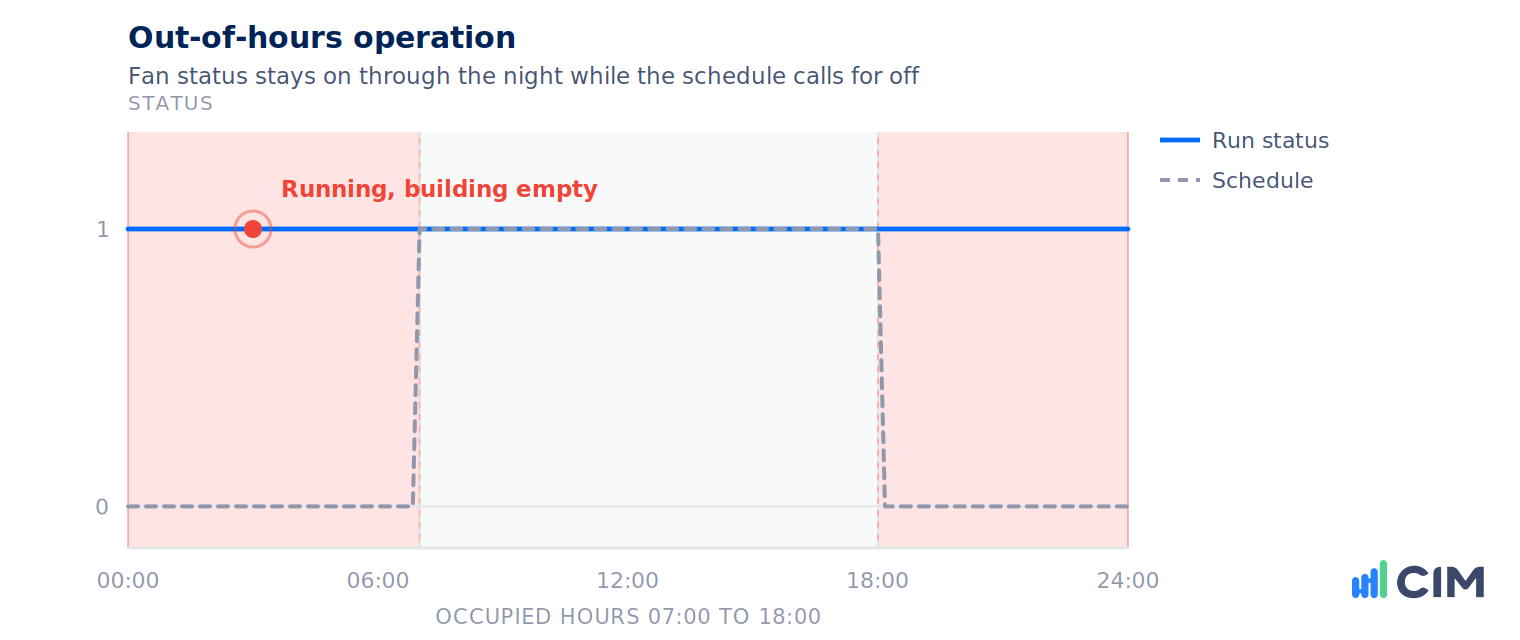
Affects 78% of buildings. Plant runs when the building is empty. It is almost never mechanical. It is a schedule changed for a reason that no longer applies, an optimum start routine that was never tuned, or a unit put into hand during a callout and left there.
Detection compares proven run status against the site's own occupancy schedule. The alerts read Confirm Unit Overnight Operation, Confirm Unit Weekend Operation and Confirm Unit Early Morning Operation.
The cost range is enormous. We have closed individual tickets worth A$29,120 for a group of units running overnight, and others worth less than A$20 for a small exhaust fan. The units nobody walks past, pumps and exhaust fans in particular, are the ones that run for years. Schedules are the first thing to check in any HVAC energy efficiency programme, and the first thing to drift back.
Added up, they matter. At one London headquarters, sixteen of the first 38 actions raised after go-live were plant running outside occupied hours, and working through them was a large part of a 14% fall in electricity use in 11 weeks.
2. Sensor faults
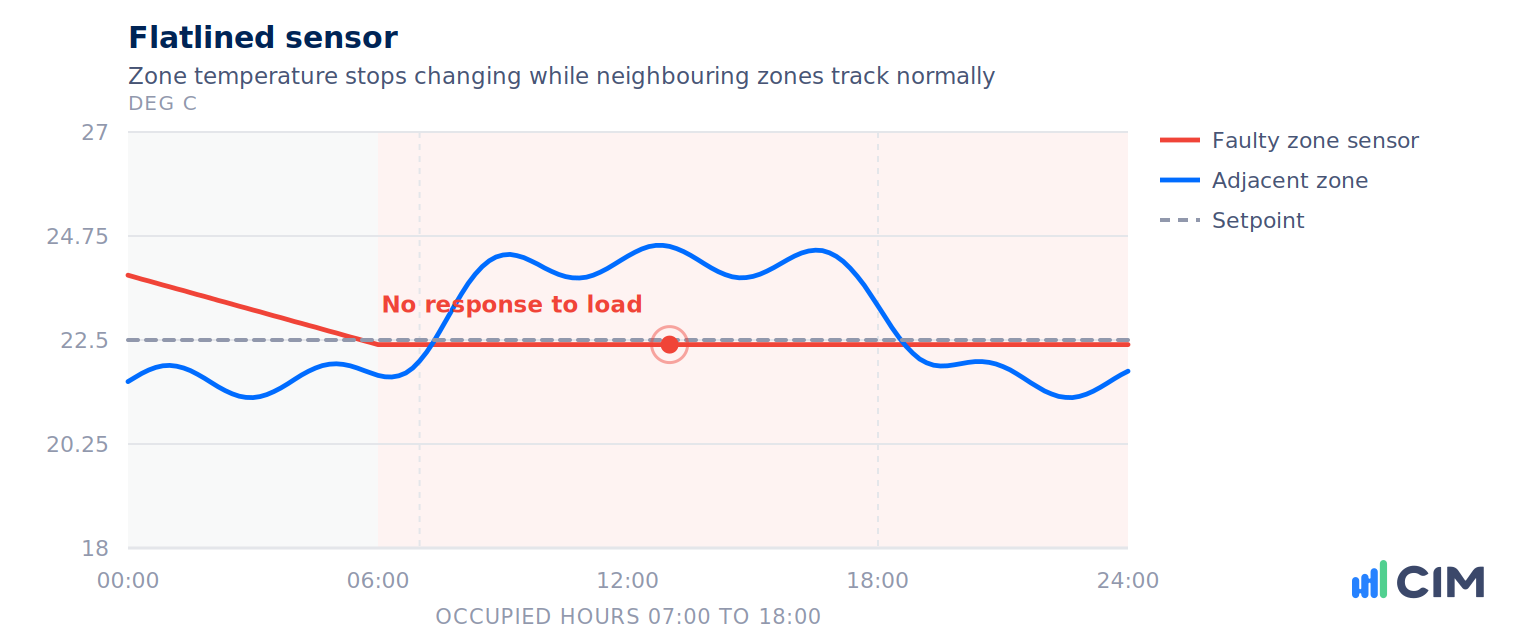
Affects 78% of buildings. The largest fault family we see, and the one with the widest consequences. A sensor that has failed, drifted or flatlined makes every control decision downstream of it wrong, and every report built on it wrong too.
Three signatures give it away: a value physically out of range, a value that has not moved when it should have, or a value that disagrees with a trusted reference. A broken outside air temperature sensor is the worst of them, because it silently disables the economy cycle across an entire AHU fleet. At one Sydney office tower, an outside air sensor installed inside a riser was reading 4°C or more out, and relocating it helped cut winter chiller runtime by 88%.
Sensor faults rarely carry a direct saving on their own. They carry everything else. If you cannot measure the building, you cannot optimise it, verify it, or report on it. They are also a major contributor to BMS alarm fatigue, because a broken sensor generates noise indefinitely until somebody replaces it.
3. Plant not operating
Affects 85% of buildings, the highest prevalence of any fault. A unit commanded to run that never starts, or starts and then fails. Detection compares run command against proven status and alerts when the two disagree for longer than the unit's normal start time.

This is the reliability argument for continuous monitoring in one line: without it, you find out when a tenant calls. It is also the boundary between predictive maintenance and reactive callouts, and it is why commercial HVAC maintenance built on fixed intervals alone leaves gaps.
One caution worth knowing is that a status switch is itself one of the most commonly failed sensors, so proving a unit is running needs a second signal such as motor current or a measured temperature change across the coil.
4. VAV airflow faults
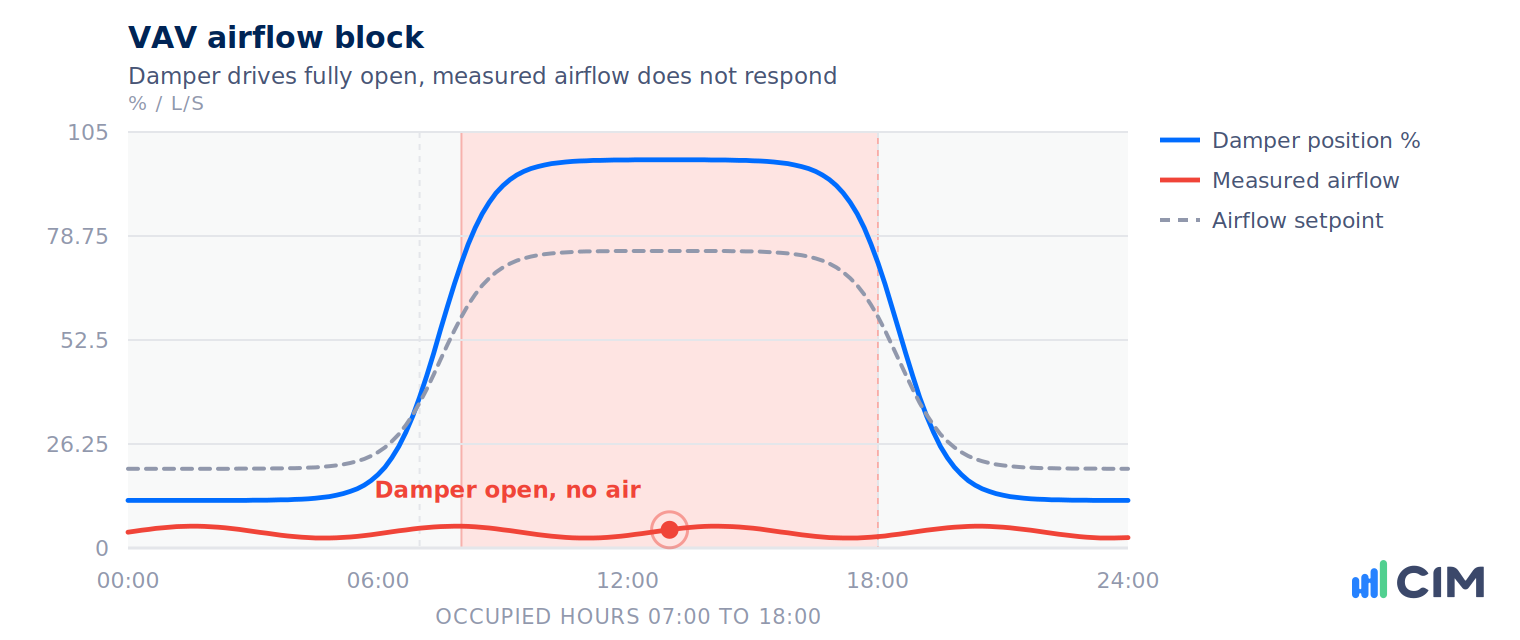
Affects 46% of buildings. Three distinct faults that look similar on a dashboard: a box that cannot deliver the air it is asked for, a box leaking air when commanded shut, and a box delivering far more than the zone needs.
Detection compares commanded damper position against measured airflow. Open damper with no airflow is a block. Airflow with the damper shut is a leak. The systemic cost is larger than any single box, because a floor of blocked boxes drives the parent AHU fan to full speed chasing a static pressure setpoint it can never reach.
5. Zone setpoints set too low
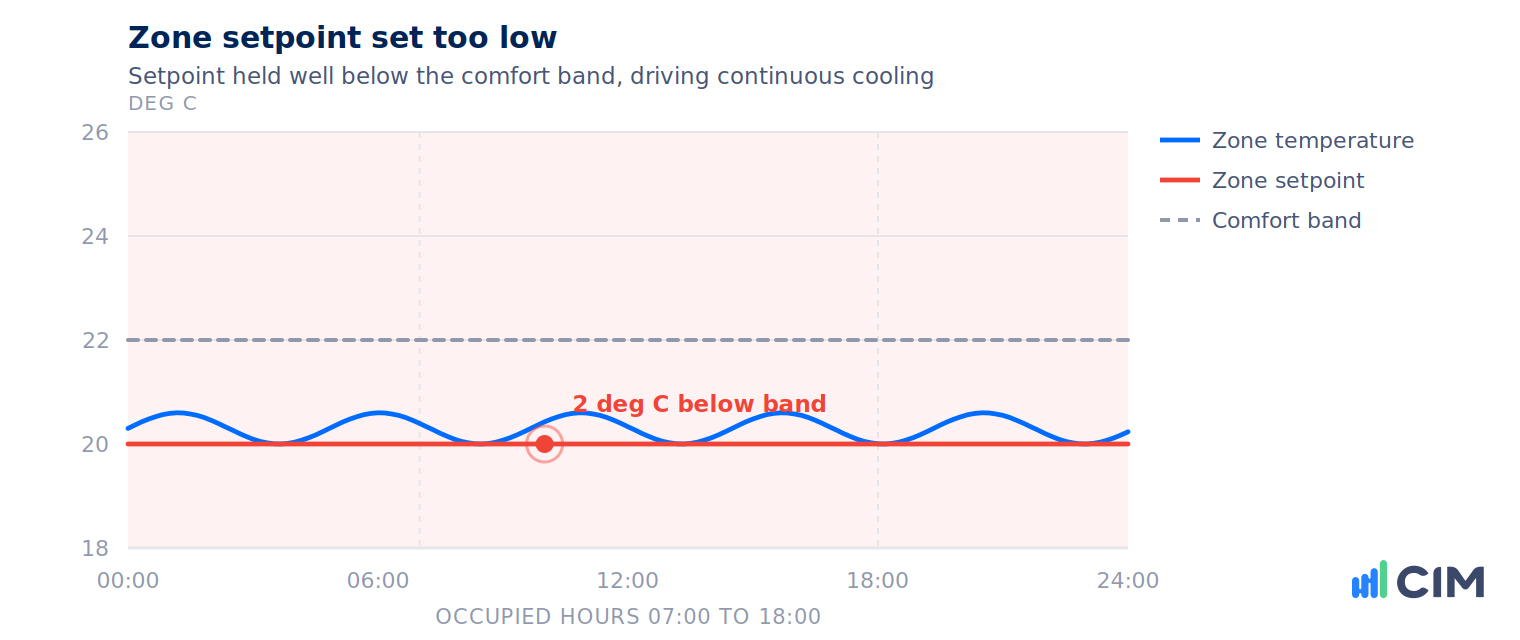
Affects 36% of buildings. Setpoints driven to extremes nobody needs, and zones that never reach the setpoint they have been given. One site closed A$15,230 a year simply by realigning zone setpoints across the building. Another closed A$3,079 by raising VAV setpoints to 23°C to stop persistent overcooling.
These are the easiest wins on the list to explain and the easiest to lose, because the setpoint goes straight back down the next time somebody complains about a cold corner. Treating them as a thermal comfort question rather than an energy one is usually what makes the change stick.
6. Passing and stuck valves

Affects 46% of buildings. Less than a twentieth of alerts, and the top of the entire savings chart.
A control valve that is not doing what it has been told. It passes water when commanded shut, sticks in position, has been overridden, or hunts continuously. The building generates heating or cooling and then delivers it where nobody asked for it.
Detection compares valve command against the temperature change across the coil. A valve at 0% with supply air running materially colder than the air entering the coil means cooling nobody requested. We have closed single valve faults worth A$63,316 and A$56,117 a year.
This is also the fault that proves why verification matters. A passing valve looks identical to a healthy valve on every screen in the building. The only way to know is to measure the control signal at the actuator, observe actual stem position, and check the temperature differential across the coil, all at the same moment. Once confirmed, the repair itself is usually straightforward and often already covered by your maintenance contract, which we cover in costing remedial works from FDD.
7. Economy cycle not enabling
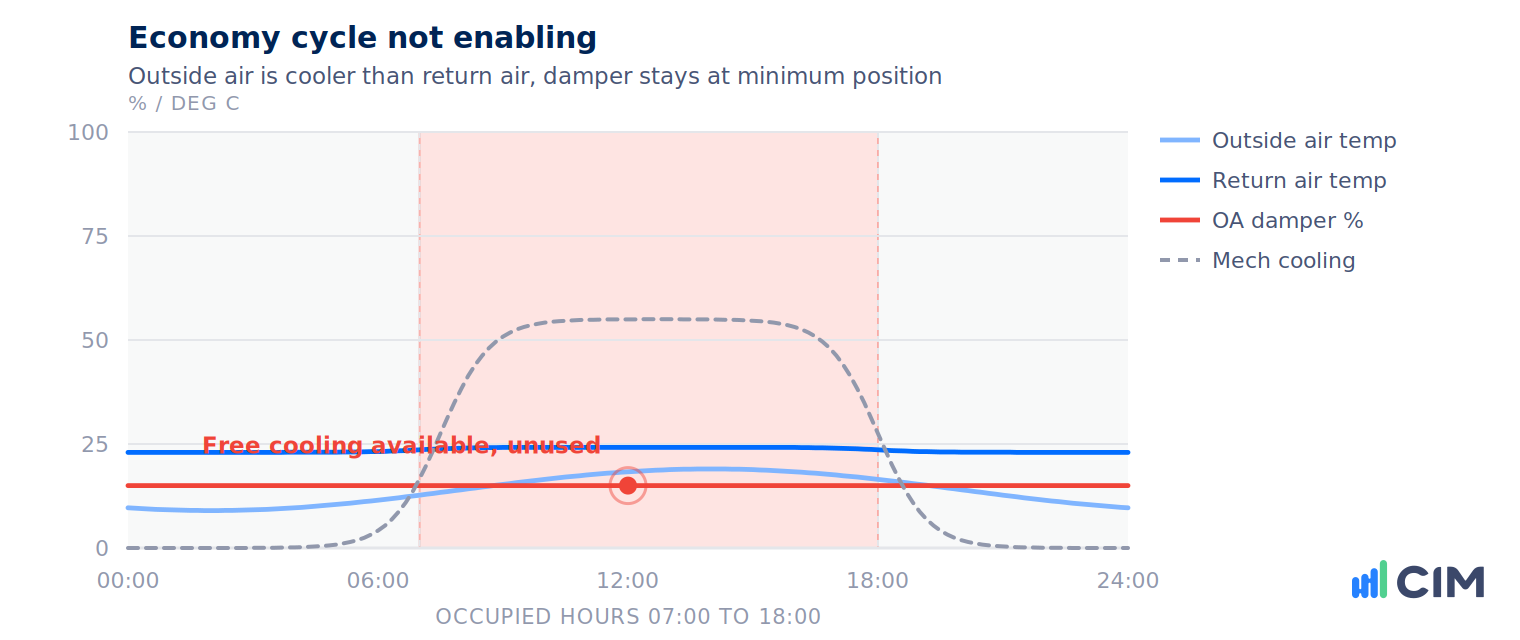
Affects 40% of buildings. Outside air dampers stuck, seized, overridden or hunting, and economy cycles that never enable when conditions would allow it. Detection compares outside air conditions against return air conditions to establish whether free cooling was available at the moment the unit declined to use it.
Before blaming the damper, check the outside air temperature sensor. A large share of economy cycle faults trace back to a sensor sitting in direct sun or near an exhaust discharge, reading several degrees high and quietly locking out free cooling for the whole plant. Where a site has adopted ASHRAE Guideline 36 sequences, this fault becomes far easier to spot because the expected behaviour is explicitly defined.
8. Overrides left in place

Affects 42% of buildings. A point put into hand during a callout, a commissioning exercise or a complaint, and then forgotten. Detection reads the BACnet priority array and establishes that a human, not the control programme, is setting the value.
One site was losing A$40,865 a year to fan speed overrides. Another A$12,300 to a single pump VSD left overridden on. There is only one root cause here and it is not technical. An override gets placed to solve an immediate problem, and nothing in the process brings it back.
This is the clearest example on the list of why fault detection alone is not enough. Finding the override is trivial. Making sure it stays released is the actual job, and no building management system will tell you unprompted that a point has been in hand for eight months.
9. Unachievable static pressure setpoints

Affects 52% of buildings. Fans working harder than they need to, or not delivering what they should. A fan pinned at 100% that cannot reach setpoint is telling you the setpoint is wrong, the filters are loaded, or the system has a restriction. It is not a fan problem.
Verified savings here include A$14,067 and A$13,923 for supply air loss on individual units, and A$9,239 at a site where fans were locked at full speed against setpoints that were unachievable by design.
10. Simultaneous heating and cooling

Affects 24% of buildings. Heating and cooling energy delivered to the same air stream or the same zone at the same time. Detection compares heating and cooling valve commands, or stage status, at the same timestamp.
One AHU alone accounted for A$46,380 a year, the third largest verified saving in the portfolio. A common and less obvious cause is an aggressive dehumidification setpoint driving reheat that nobody asked for. One site was losing A$4,166 a year to exactly that. At a Melbourne museum, a humidity setpoint tightened from 55% to 50% RH had one gallery unit cooling and reheating 295 times a week, and restoring it cut winter chiller runtime from 37% to 2.5%.
11. Missing reset strategies

Affects 18% of buildings. Low volume, high value. Supply air temperature, duct static pressure, chilled water pressure, condenser water temperature. Setpoints held at a worst-case number the whole year round because the reset strategy was specified, never commissioned, or disabled during a fault investigation and never restored.
Verified savings include A$30,000 for a supply air temperature reset, A$12,980 for a cooling tower reset strategy, and A$10,114 at a site with no chiller plant outside air temperature lockout configured at all.
This is a fault you cannot find in a day. It only becomes visible when you can see a setpoint sitting still across months of changing weather, which is why it belongs to monitoring-based commissioning rather than a site visit.
12. Short cycling
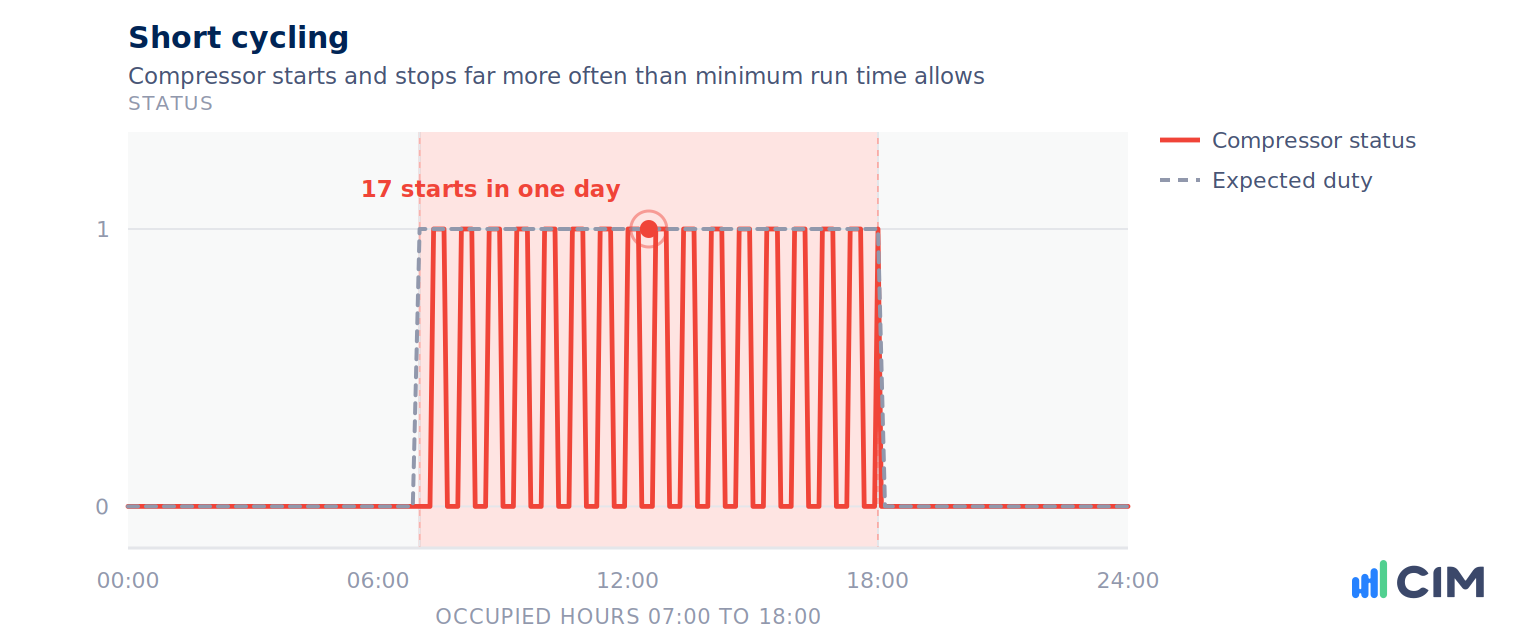
Affects 27% of buildings. Plant starting and stopping far more often than it should. Detection counts start events over a rolling window against the minimum run time the plant type should observe.
Short cycling presents as an energy fault and is really a reliability one. The cost is compressor life, not kilowatt hours, which turns it into a capital planning problem disguised as an operations problem, and a quiet contributor to deferred maintenance backlogs.
13. Low delta-T

Affects 15% of buildings. Water circulating without giving up or picking up its heat. Pumps run harder, chillers run at poor efficiency, and additional plant stages on for no reason. One chiller alone carried A$12,189 a year.
Worth knowing: low delta-T across a system is very often a symptom rather than a cause, and what it is usually a symptom of is passing valves at the terminal units. If you have this, go back and read the valve section. Systemic water-side problems like this are typically what a retro-commissioning exercise is scoped to find.
14. Flatlined and offline sub-meters

Affects 38% of buildings. Meters that have stopped reporting, are repeating the same value, are reading negative, or are showing consumption in an empty building. Overnight water consumption in particular is a leak until proven otherwise, and we have closed individual tickets worth A$7,776 and A$6,552 on exactly that.
The larger cost is reporting integrity. You cannot report NABERS, GRESB or any disclosure obligation on data that quietly flatlined in month two, and the gap is usually discovered at reporting time when it is too late to do anything about it. The same applies to any energy benchmarking exercise built on the same meter tree.
15. Dirty filters
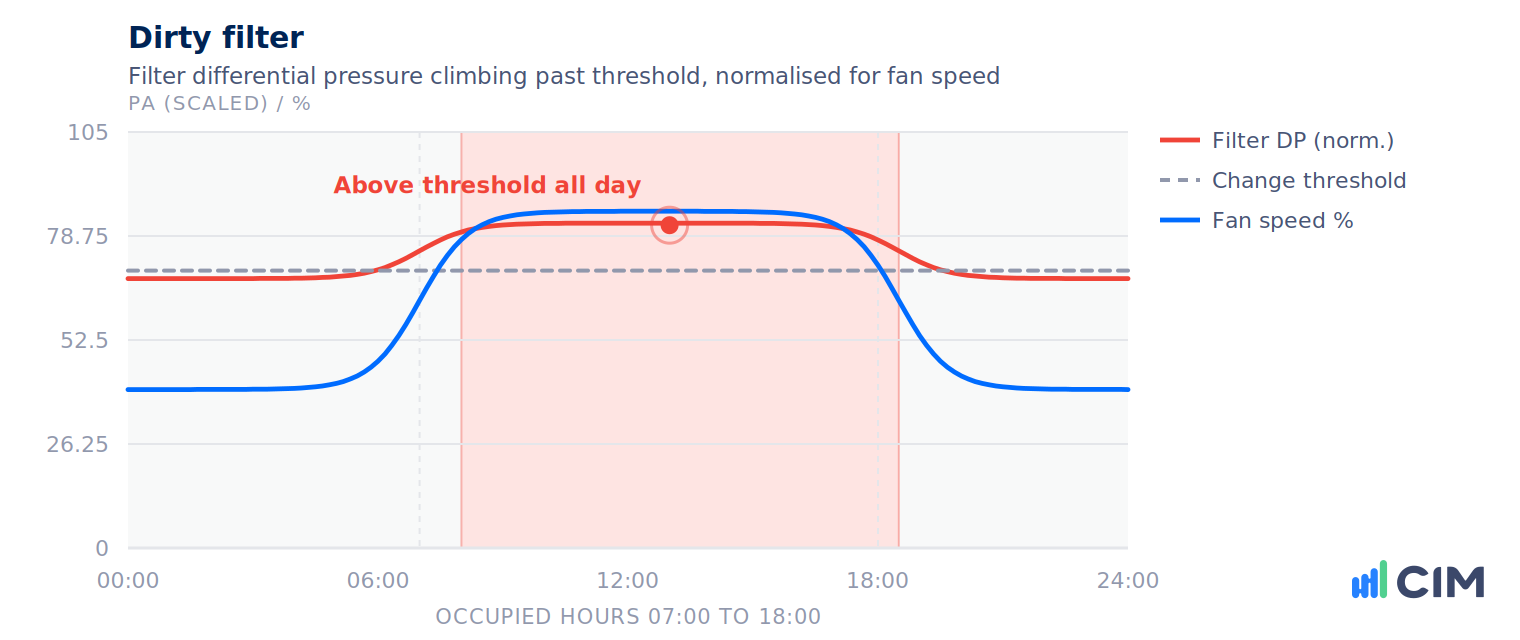
Affects 23% of buildings. Filters past their useful life, and the differential pressure sensors that are meant to tell you so. Detection normalises filter DP for fan speed, so a filter is not flagged simply because the fan is working harder for another reason.
The reason this earns a place on the list is its connection to the pressure section above. Loaded filters are one of the most common reasons a supply fan cannot reach its static pressure setpoint, which means a filter change sometimes resolves an alert that presented as a control problem. It is also the clearest case for moving from fixed-interval to condition-based HVAC maintenance.
What this list is actually telling you
Three things stand out when you look at twelve months of faults across a portfolio this size.
The expensive faults are invisible. Every fault at the top of the savings chart looks completely normal on a BMS graphic. The valve shows 0%. The unit shows running. The setpoint shows a sensible number. You only find these by comparing signals against each other, continuously, which is what fault detection and diagnostics exists to do, and what separates it from a building energy management system that reports consumption without explaining it.
A large share of them are human. Overrides left in place, setpoints changed for a complaint, schedules adjusted for an event. These are not equipment failures. They are process failures, and no amount of better hardware fixes them.
Finding a fault is the easy half. This is the part the industry consistently underplays. Detection is largely a solved problem. Plenty of platforms will generate this list. What almost none of them do is confirm the fault was actually rectified, by somebody who is not the person who reported it fixed.
Detection is not the finish line
A fault is not resolved when it is raised, assigned, or marked complete. It is resolved when the data shows it is gone and someone independent has confirmed it.
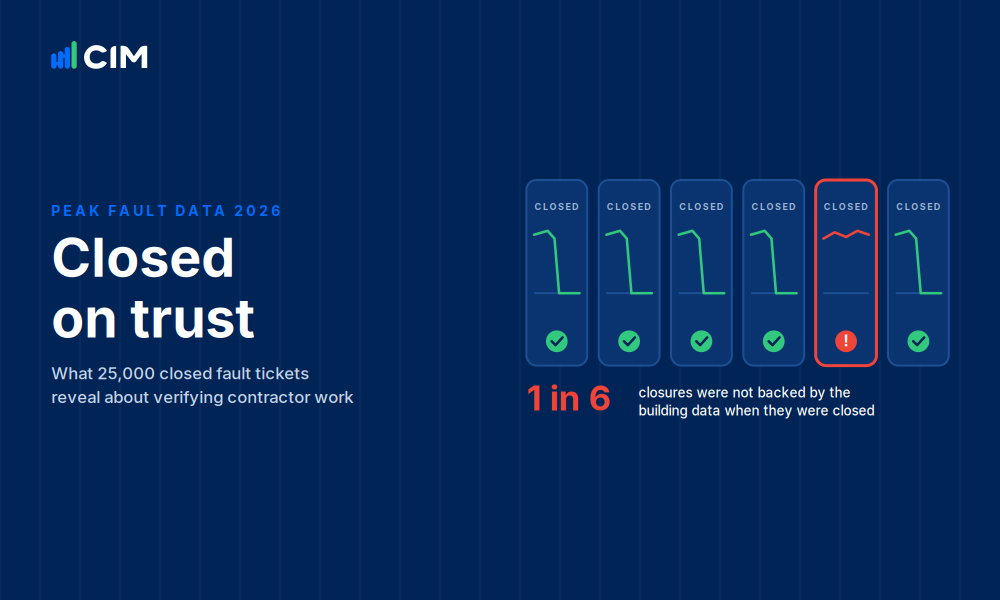
The gap between those two states is where most building analytics programmes quietly fail. A schedule gets corrected and the next callout puts the unit straight back into hand. A valve is reported replaced and the coil is still cooling a week later. A setpoint is realigned and drifts back within a fortnight. Every one of those shows as closed on a work order and open in the data. In a sample of closed tickets across CIM's portfolio, about 1 in 6 were closed before the building data confirmed the fix, which we unpack in contractor accountability and how to verify a fault was actually fixed.
This is why we treat closed-loop verification as the point of the exercise rather than a nice-to-have, and why independent building monitoring matters more than the number of rules a platform ships with. Nobody should be marking their own homework, and on a portfolio of any size nobody can remember what was actually checked. The platform has to carry that, continuously, or the savings above are theoretical. Proving the saving itself, as opposed to the fix, is a separate discipline with its own methodology, which we cover in our guide to measurement and verification of energy savings.
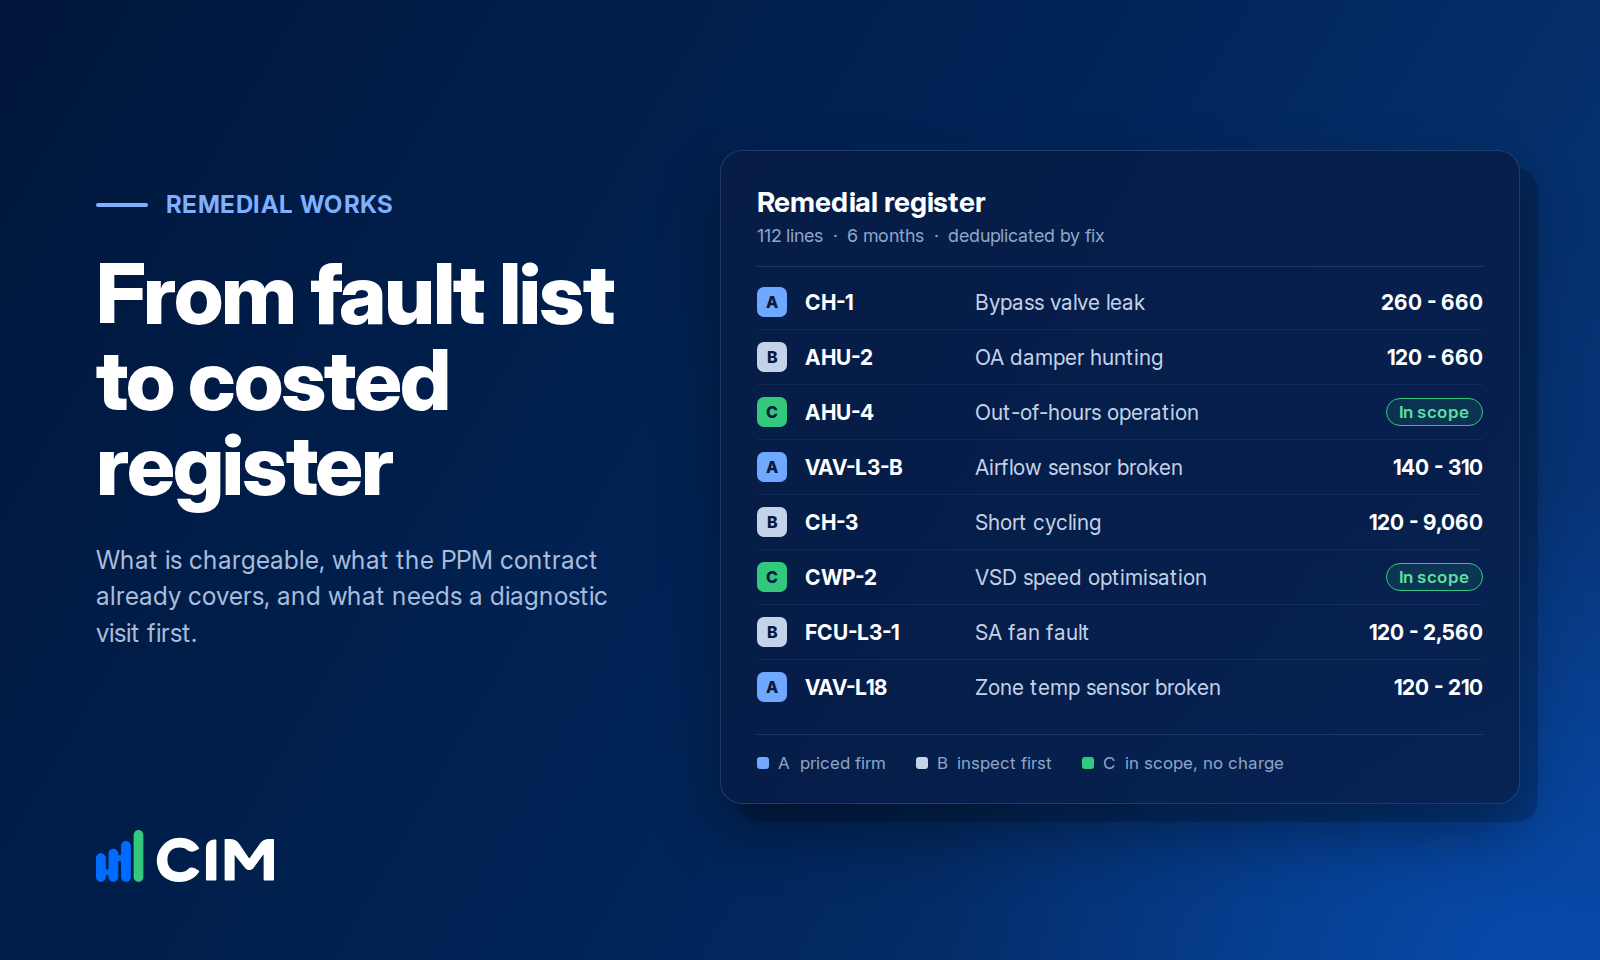
If you want the practical version of this, our FDD Playbook for building performance engineers covers taking a fault from detection through to verified rectification, our guide to costing remedial works from FDD covers what is chargeable and what your PPM contract already includes, and our guide for engineering firms covers how RCx and MBCx programmes are run on fault detection. For direct answers on how PEAK finds and verifies these faults, which BMS platforms it reads and how it is priced, see the CIM and PEAK FAQ.
Frequently asked questions
What is the most common HVAC fault in commercial buildings?
Plant failing to start is the most widespread, affecting 85% of buildings we monitor. By raw alert volume the most common individual fault is equipment running outside occupied hours, which affects 78% of buildings.
How many HVAC faults does a typical commercial building have at once?
More than most teams expect. Across our monitored portfolio the median building carried seven distinct fault families over a twelve month period, and roughly three quarters of buildings carried five or more. Very few buildings carry only one.
Which HVAC fault costs the most?
Valve faults. Passing and leaking control valves produced the two largest verified savings in our portfolio over the last twelve months, at A$63,316 and A$56,117 a year from single air handling units. Valve faults are less than 5% of alert volume.
What is a passing valve and why does it matter?
A passing valve is a control valve that allows water through even when it has been commanded fully shut, usually because debris or wear stops the seat sealing. It matters because the building pays to generate heating or cooling that is then delivered where nobody asked for it, and because the valve appears completely normal on the BMS graphic.
How are HVAC faults detected automatically?
Fault detection software compares related data points against each other and against expected behaviour. A valve commanded shut while the coil still changes air temperature, a fan commanded on with no proven run status, a setpoint that never moves while load changes. Each pattern is a rule, and the rules run continuously rather than at inspection intervals.
What is the difference between an HVAC fault and a BMS alarm?
A BMS alarm fires when a single value crosses a threshold it has been configured to watch. A fault is a pattern across several values over time. Most of the faults in this list never breach a threshold on any individual point, which is why they do not alarm and can persist for years.
Can a BMS find these faults on its own?
Generally not. A BMS alarms on thresholds it has been told to watch. Almost every fault in this list is invisible to a threshold alarm because no single point is out of range. The fault only appears when you compare points against each other over time.
Can an engineer find these faults manually without FDD software?
Yes, for a single unit. A competent engineer with BMS trend access can identify any fault on this list. The difficulty is scale and persistence. Checking every valve, schedule, sensor and setpoint across a portfolio every day is not realistic manually, and faults that are corrected frequently return without anyone noticing.
How much energy do HVAC faults waste?
It varies enormously by fault and by building. For context on what systematic rectification is worth, LBNL's analysis of commissioning across roughly 1,500 North American buildings found a median simple payback of 1.7 years for existing-building projects. In our own portfolio, individual verified rectifications have ranged from under A$20 a year to over A$63,000 a year.
Which HVAC faults should be fixed first?
Safety and reliability faults first, then faults on the largest plant. After that, prioritise by cost rather than by alert count. Valve faults, overrides left in place, simultaneous heating and cooling, and missing reset strategies produce the largest verified savings despite being among the least frequent alerts.
Are HVAC faults covered by a maintenance contract?
Some are and some are not. Inspection, cleaning and adjustment tasks are usually inside a planned maintenance scope, while component replacement and control strategy changes are typically chargeable additional works. The boundary depends on the specific contract, so each fault should be scoped against it before work is instructed.
How do you know an HVAC fault was actually fixed?
By confirming in the data that the fault condition no longer occurs across a full operating cycle, and by holding field evidence from the person who attended. A work order marked complete is not evidence. Many faults, particularly schedule changes and overrides, reappear within weeks unless the platform continues to watch for them.
Method: based on analysis of more than 28,000 fault alerts raised across CIM's monitored portfolio of 600+ commercial buildings between September 2025 and September 2026. Savings figures are verified outcomes from completed rectification work, not modelled estimates, and are stated in Australian dollars. Prevalence is expressed as a share of buildings monitored. All figures de-identified.

A practical playbook for the engineers who deliver building performance. Learn how to run retro-commissioning, monitoring-based commissioning and data-driven maintenance on an FDD platform: compress the RCx cycle from 12-18 months to 3-5, close the loop from alert to verified fix, and turn fixed-term projects into recurring revenue. Written for RCx and MBCx firms, engineering consultancies, and BMS and mechanical contractors.
A museum buffer tank was failing to keep the chiller off in winter. PEAK traced the cause to two control settings, and fixing them cut chiller runtime from 37% to 2.5% with no capital spend.
Read the story →