Most building faults don't announce themselves. A damper sticks half-open, a valve leaks by a few percent, a schedule drifts by an hour - and the building keeps running. Tenants stay comfortable, no alarm sounds, and nobody raises a work order. The only evidence is on the energy bill, months later, buried in a number nobody can explain.
Fault detection and diagnostics - FDD - is the discipline of finding those faults automatically, working out what caused them, and putting them in front of the person who can fix them. It's one of the highest-return capabilities available to a commercial building operator, and one of the least understood.
This guide is the complete reference: what FDD is, how it works, how it differs from the systems you already own, what it finds, what it's worth, how it connects to a twenty-year-old BMS, which buildings it suits, who actually uses it day to day, and where the technology is heading.
On this page
- What is fault detection and diagnostics?
- Key FDD terminology: a plain-English glossary
- How common are faults, really?
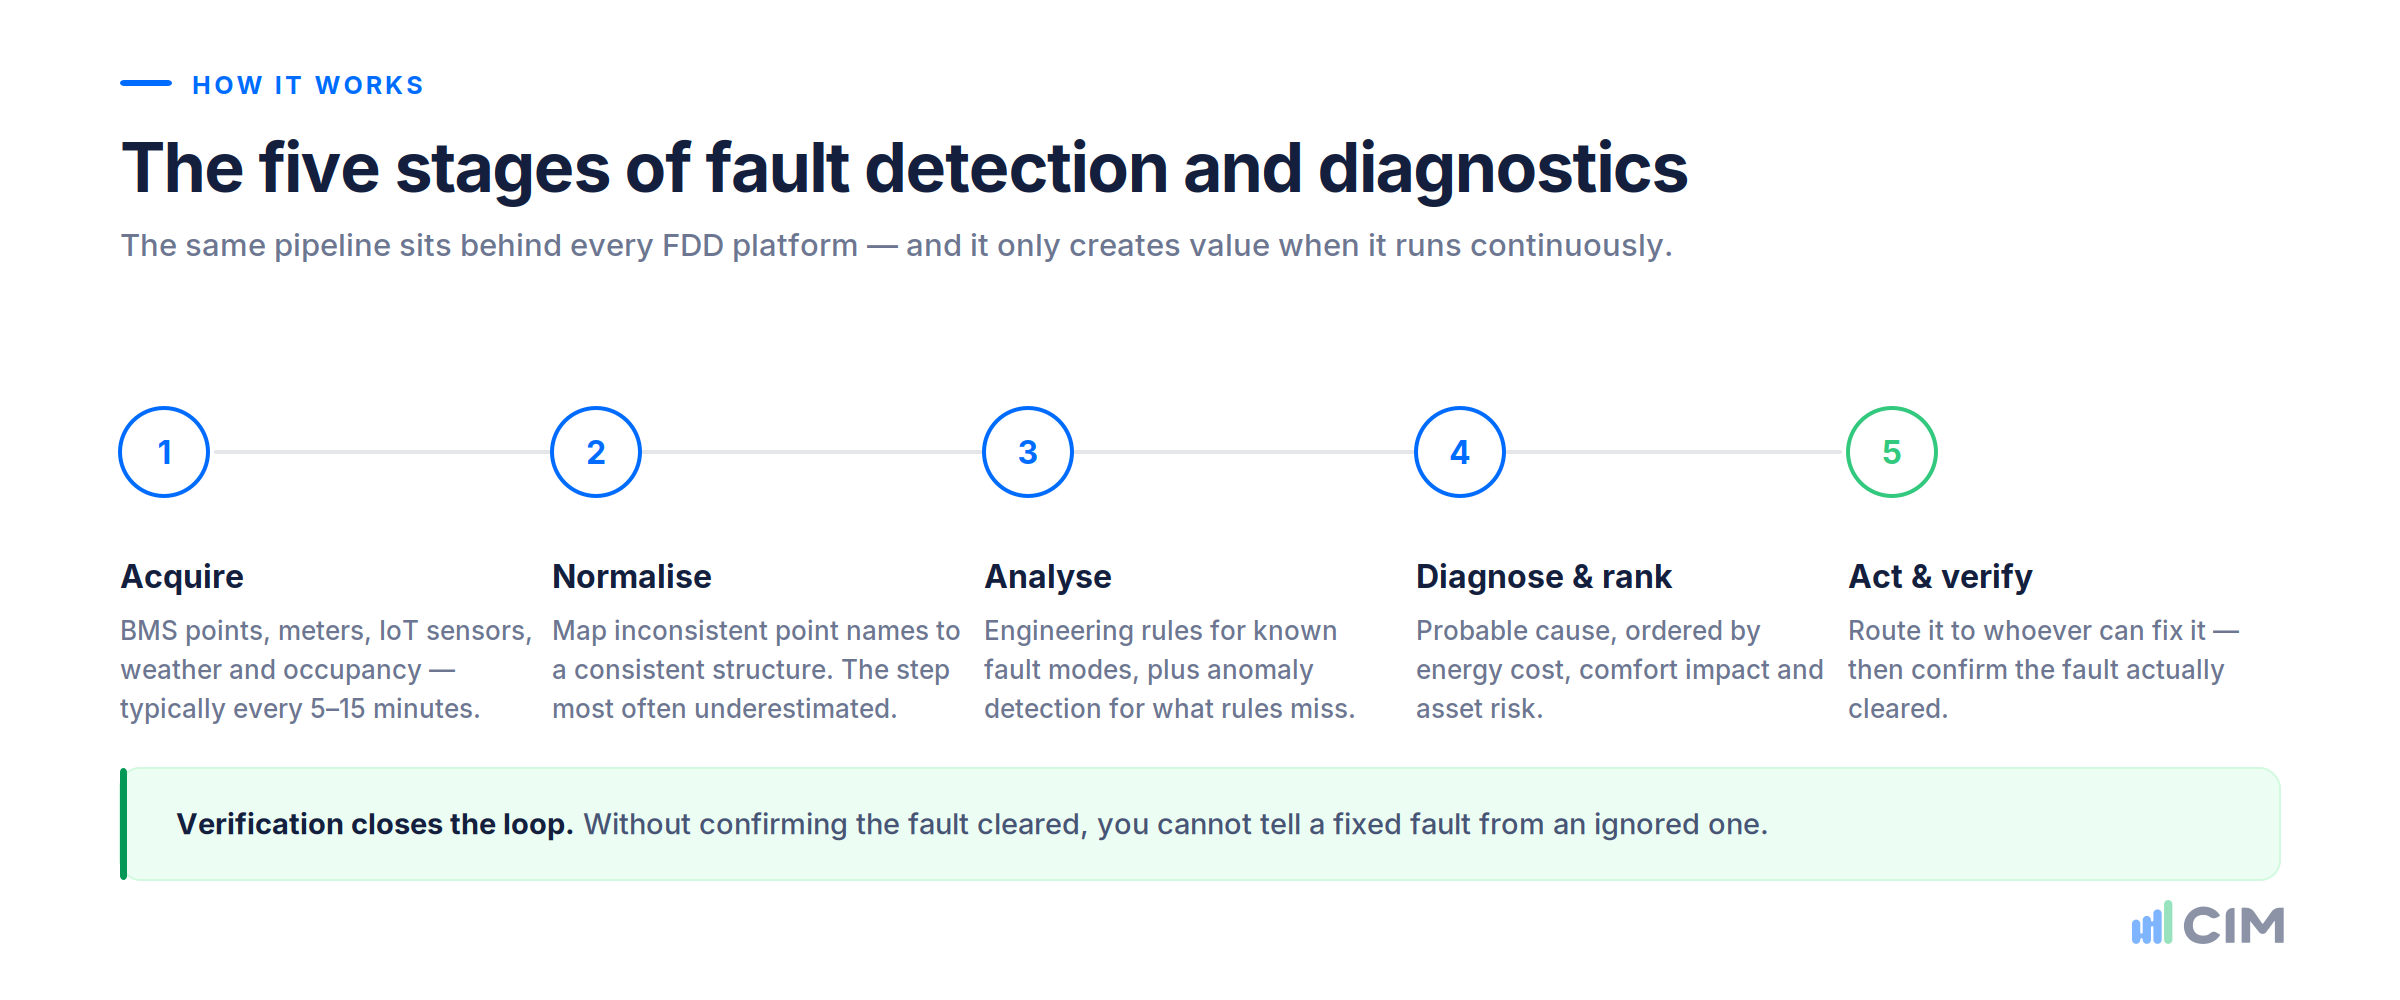
- How FDD works: the five stages
- FDD vs BMS and BAS: what each system actually does
- FDD vs DDM: the engine and the operating model
- How FDD relates to the rest of the building technology stack
- The faults FDD typically finds
- What FDD is worth: benefits and the value journey
- Integrating FDD with an existing BMS and legacy infrastructure
- Which buildings is FDD suited to?
- Who uses FDD, and how: user groups and workflows
- Where FDD is required, not just recommended
- Where FDD is heading: seven trends
- Deploying FDD: a practical sequence
- Common pitfalls
- How to evaluate an FDD platform
- Frequently asked questions
- Where FDD fits in a building analytics strategy
- The bottom line
What is fault detection and diagnostics?
Fault detection and diagnostics is a software capability that continuously analyses building data - typically from a building management system, meters and sensors - to identify equipment and control problems, diagnose their likely cause, and prioritise them for action.
It has two distinct halves, and the difference matters:
Detection answers “is something wrong?” It compares how equipment is behaving against how it should behave. A chilled water valve commanded shut but showing a temperature drop across the coil is a detected fault.
Diagnostics answers “what is wrong, and why?” It narrows the possibilities to a probable cause - the valve is leaking by, the actuator has failed, or the sensor is reading incorrectly - so the person receiving it knows what to investigate.
A system that only detects gives you a list of symptoms. A system that diagnoses gives you something a technician can act on. When FDD is described as “automated fault detection and diagnostics” (AFDD), the emphasis is on doing both continuously and without human analysis.
Key FDD terminology: a plain-English glossary
The category is thick with acronyms, and several are used loosely by vendors. These are the terms you'll meet in a procurement process, defined as practitioners actually use them.
The core vocabulary
| Term | What it means in practice |
|---|---|
| FDD | Fault detection and diagnostics. Software that finds equipment and control faults in building data and identifies probable cause. |
| AFDD | Automated FDD. The same thing, with the emphasis on running continuously without an analyst driving it. Used interchangeably with FDD by most vendors. |
| Fault | A condition where equipment or controls are not operating as intended. Not the same as a failure - most faults involve equipment that is still running. |
| Failure | Equipment has stopped working. A BMS alarm typically catches this; FDD catches the months of degraded operation that preceded it. |
| Rule | An explicit piece of engineering logic that tests for a specific fault condition - for example, heating valve open while cooling valve is open for more than 15 minutes. |
| Fault library | The full set of rules a platform applies, usually organised by equipment type: AHU, chiller, VAV box, boiler, pump. |
| False positive | A flagged fault that isn't real, usually caused by incorrect point mapping, a sensor issue or an untuned rule. The single biggest threat to a programme's credibility. |
| Triage | The human process of reviewing new faults, deciding which matter, and assigning them. |
| Closing the loop | Confirming a fault has actually cleared after work was done, rather than assuming it. |
Data and connectivity
| Term | What it means in practice |
|---|---|
| Point | A single data value from the building - a sensor reading, a setpoint, a command, a status. Point count is the standard unit for scoping and pricing FDD. |
| Trend / trend log | A historical record of a point's value over time. FDD needs trends, not just instantaneous values. |
| BACnet | The dominant open communication protocol in commercial building automation. See our guide to BACnet. |
| Modbus | An older, simpler protocol still common on plant-level equipment such as chillers, meters and variable speed drives. |
| OPC UA | An industrial interoperability standard sometimes used to expose BMS data, more common in campus and industrial settings. |
| Gateway / edge device | A small on-site computer that reads the BMS network and forwards data securely to a cloud platform. |
| Point mapping | Matching each raw BMS point to what it actually represents and which asset it belongs to. |
| Semantic tagging | Applying a standard vocabulary to points so software can interpret them automatically. Conventions include Project Haystack, Brick Schema and the emerging ASHRAE 223P. |
| Normalisation | Converting inconsistent raw data into a consistent structure analytics can run against. |
Adjacent systems and disciplines
| Term | What it means in practice |
|---|---|
| BMS / BAS | Building management system / building automation system. The control layer that runs the plant. Effectively synonyms - see the next section. |
| CMMS | Computerised maintenance management system. Where work orders, assets and maintenance history live. |
| EMS / EMIS | Energy management system, or energy management and information system. Focused on consumption, cost and reporting rather than equipment diagnosis. |
| MBCx | Monitoring-based commissioning. A programme that uses continuous monitoring to keep a building performing as designed. |
| RCx | Retro-commissioning. A one-off exercise to restore an existing building to correct operation. FDD makes this continuous rather than periodic. |
| DDM | Data-driven maintenance. A maintenance operating model in which analytics, not a fixed calendar, determine what gets maintained and when. |
| PPM | Planned preventive maintenance. Calendar-based servicing - the model DDM displaces. |
| Predictive maintenance | Forecasting when an asset will fail so it can be serviced beforehand. |
| M&V | Measurement and verification. Proving a saving actually occurred, using an agreed methodology such as IPMVP. |
| Guideline 36 | ASHRAE's standardised high-performance sequences of operation for HVAC, which build alarming and fault reporting into the control logic itself. |
How common are faults, really?
More common than most operators expect, and the evidence is now solid.
Researchers at Lawrence Berkeley National Laboratory analysed multi-year monitoring data from more than 60,000 pieces of HVAC equipment, examining around 90 distinct fault types. Their finding: on any given day, 40% of air handling units and 30% of air terminal units had a reported fault of some kind. The study also identified 21 separate AHU fault types affecting a fifth or more of all units monitored, many of them persisting for more than 20% of the monitored period.
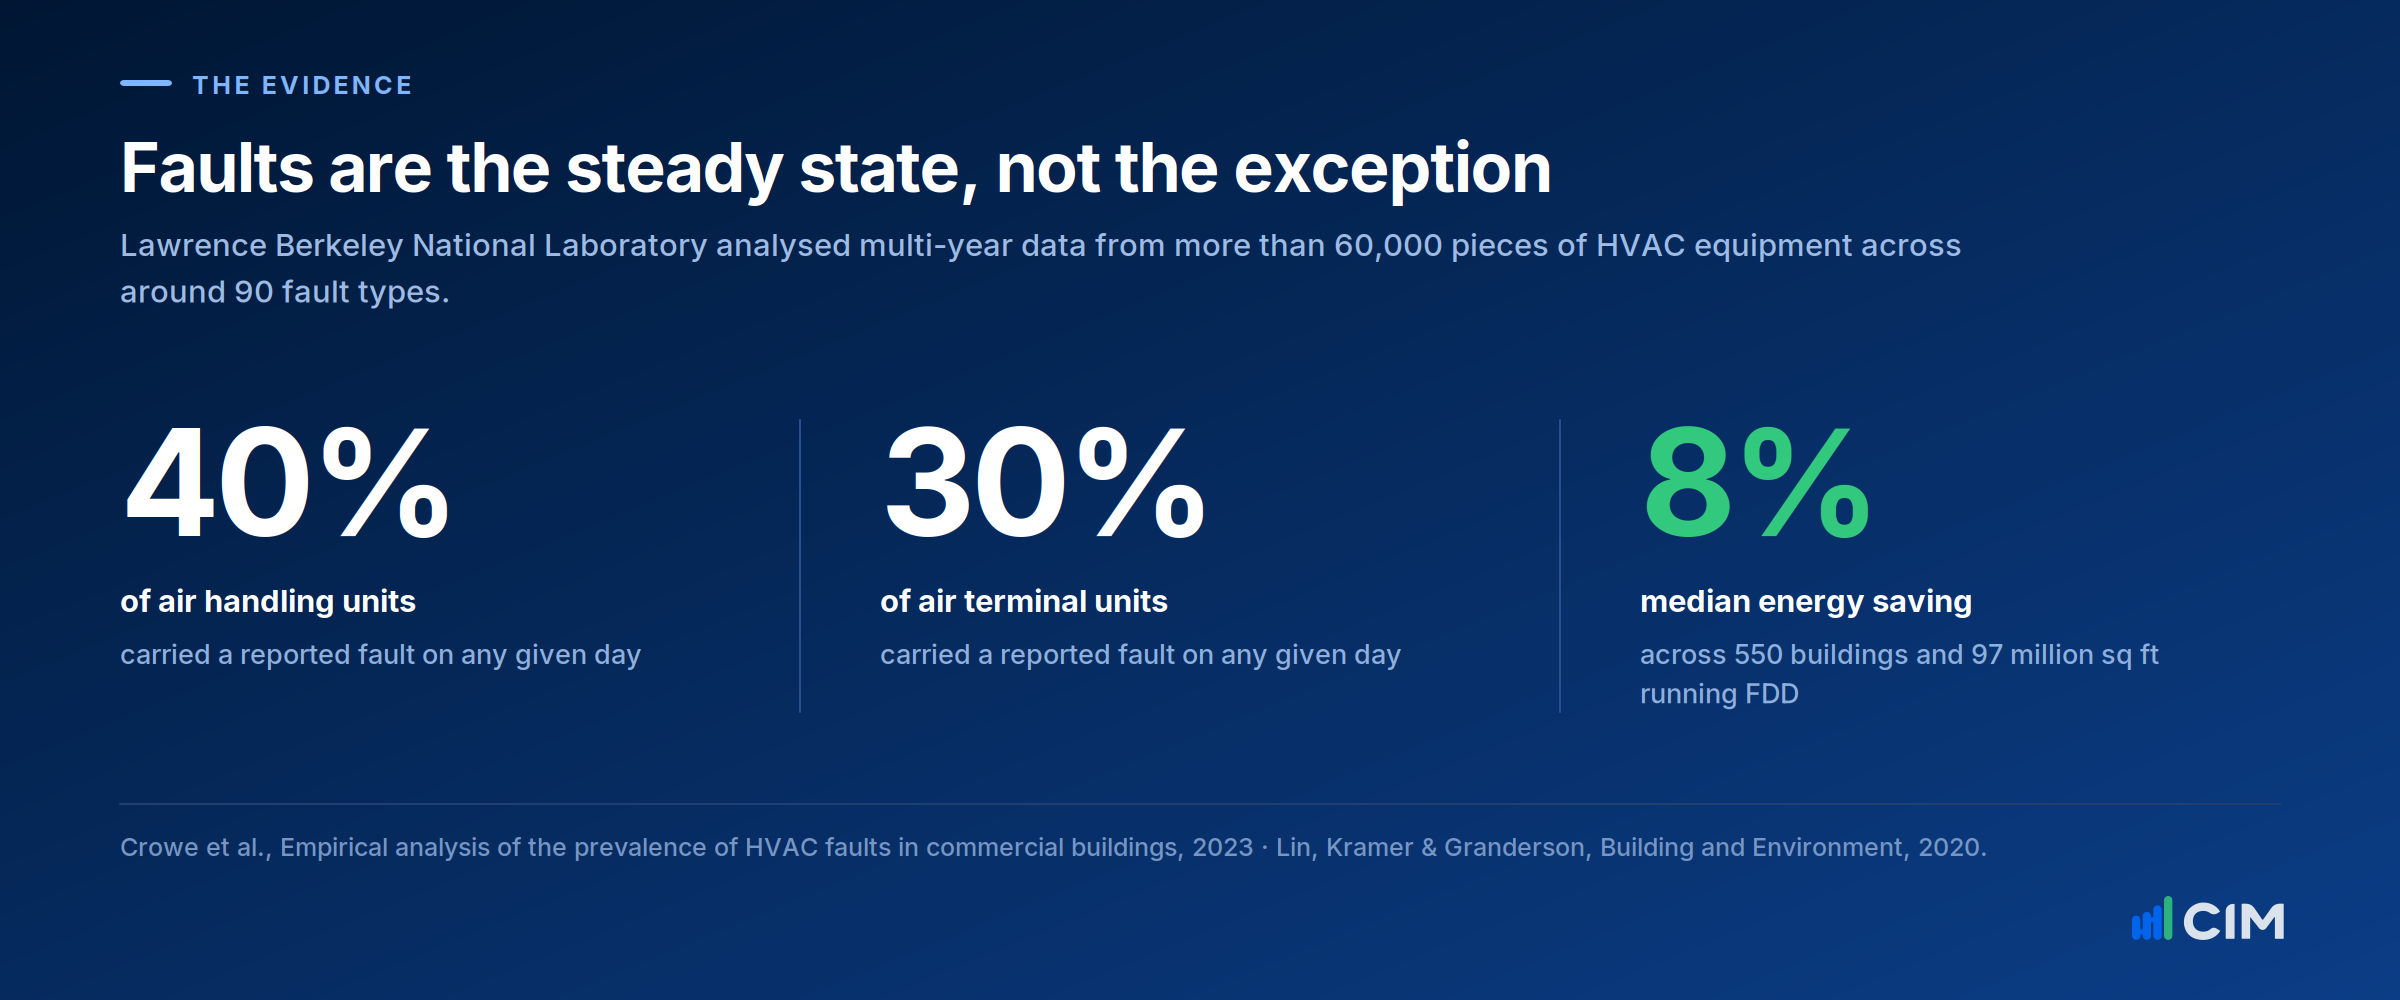
That last point is the important one. These aren't dramatic breakdowns. They are conditions that persist - quietly, for months - because nothing in the building's normal operation surfaces them. A fault that trips a plant is found within hours. A fault that wastes 15% of a chiller's energy while keeping the space comfortable can run for years.
Buildings do not lack data. They lack a mechanism for turning data into a short, ranked list of things worth fixing.
How FDD works: the five stages
Whatever the vendor, the pipeline is broadly the same.
1. Data acquisition
FDD needs building data at reasonable frequency - typically every 5 to 15 minutes. That comes from the BMS over protocols such as BACnet or Modbus, supplemented by utility meters, sub-meters, IoT sensors, weather data and, increasingly, occupancy data. Coverage matters more than exotic instrumentation: a platform reading 2,000 existing BMS points will find far more than one reading a handful of new sensors.
2. Data normalisation and tagging
Raw BMS points are named inconsistently - AHU-3_SAT, L4_AHU3_SupplyTemp and Sup_T_3 may all mean the same thing in the same building. Before any analysis can run, points must be mapped to a consistent structure describing what each one is and what equipment it belongs to. Semantic tagging conventions such as Project Haystack, Brick Schema and the emerging ASHRAE Standard 223P exist to standardise this. In practice this step is the single biggest determinant of how quickly an FDD deployment delivers value, and the one most often underestimated.
3. Analysis
This is where approaches diverge, and it's worth understanding the trade-offs.
Rule-based FDD encodes engineering knowledge as explicit logic: if the outside air temperature is below the economiser changeover point and the dampers are at minimum position, flag an economiser fault. Rules are transparent, explainable and grounded in how equipment is supposed to work. They require engineering effort to configure per site and can miss faults nobody thought to write a rule for.
Data-driven and machine-learning FDD builds a model of normal behaviour from historical data and flags deviations. It can surface unexpected patterns and adapt to a building's specific characteristics, but it needs good training data, can be opaque about why it flagged something, and risks learning that a long-standing fault is “normal”.
Hybrid approaches - the direction most serious platforms have taken - run engineering rules for known fault modes and layer anomaly detection over the top to catch what the rules don't cover.
4. Diagnosis and prioritisation
A large portfolio generates far more faults than any team can address. Good FDD ranks them - by estimated energy cost, comfort impact, equipment risk, or the effort required to fix. The output should be a work list, not a data dump. Prioritisation is what separates a platform people use from one they mute.
5. Action and verification
The fault goes to whoever can resolve it - in-house engineer, contractor, or a work order in a maintenance management system - and the platform then confirms the fault has actually cleared. Without that closing step, you can't tell a fixed fault from an ignored one, and savings claims rest on assumption.
FDD vs BMS and BAS: what each system actually does
Three points of confusion sit inside this one question, and they are worth separating.
First: BMS and BAS are the same thing
A building management system (BMS) and a building automation system (BAS) describe the same layer of technology. BMS is the more common term in Australia, the UK and Europe; BAS is more common in North America. You will also encounter BMCS (building management and control system) and EMS used loosely for the same equipment.
Where a real distinction is sometimes drawn, it is one of scope: automation implies control of plant - HVAC, boilers, chillers, air handling - while management implies a broader remit that may extend to lighting, metering, fire, access and lifts. In practice, most modern systems do both and the terms are used interchangeably. If a vendor draws a hard line between them, ask what they mean by it. Our complete guide to building management systems covers how the control layer itself works.
Neither is FDD. Both are the control layer. FDD is an analytics layer that sits above them.
Second: FDD is not a BMS alarm
The most common objection to FDD is understandable: “our BMS already alarms.”
It does - but BMS alarms and FDD answer different questions. A BMS alarm is generally threshold-based and instantaneous: a value crossed a limit, a device stopped responding, a plant tripped. It tells you something has broken.
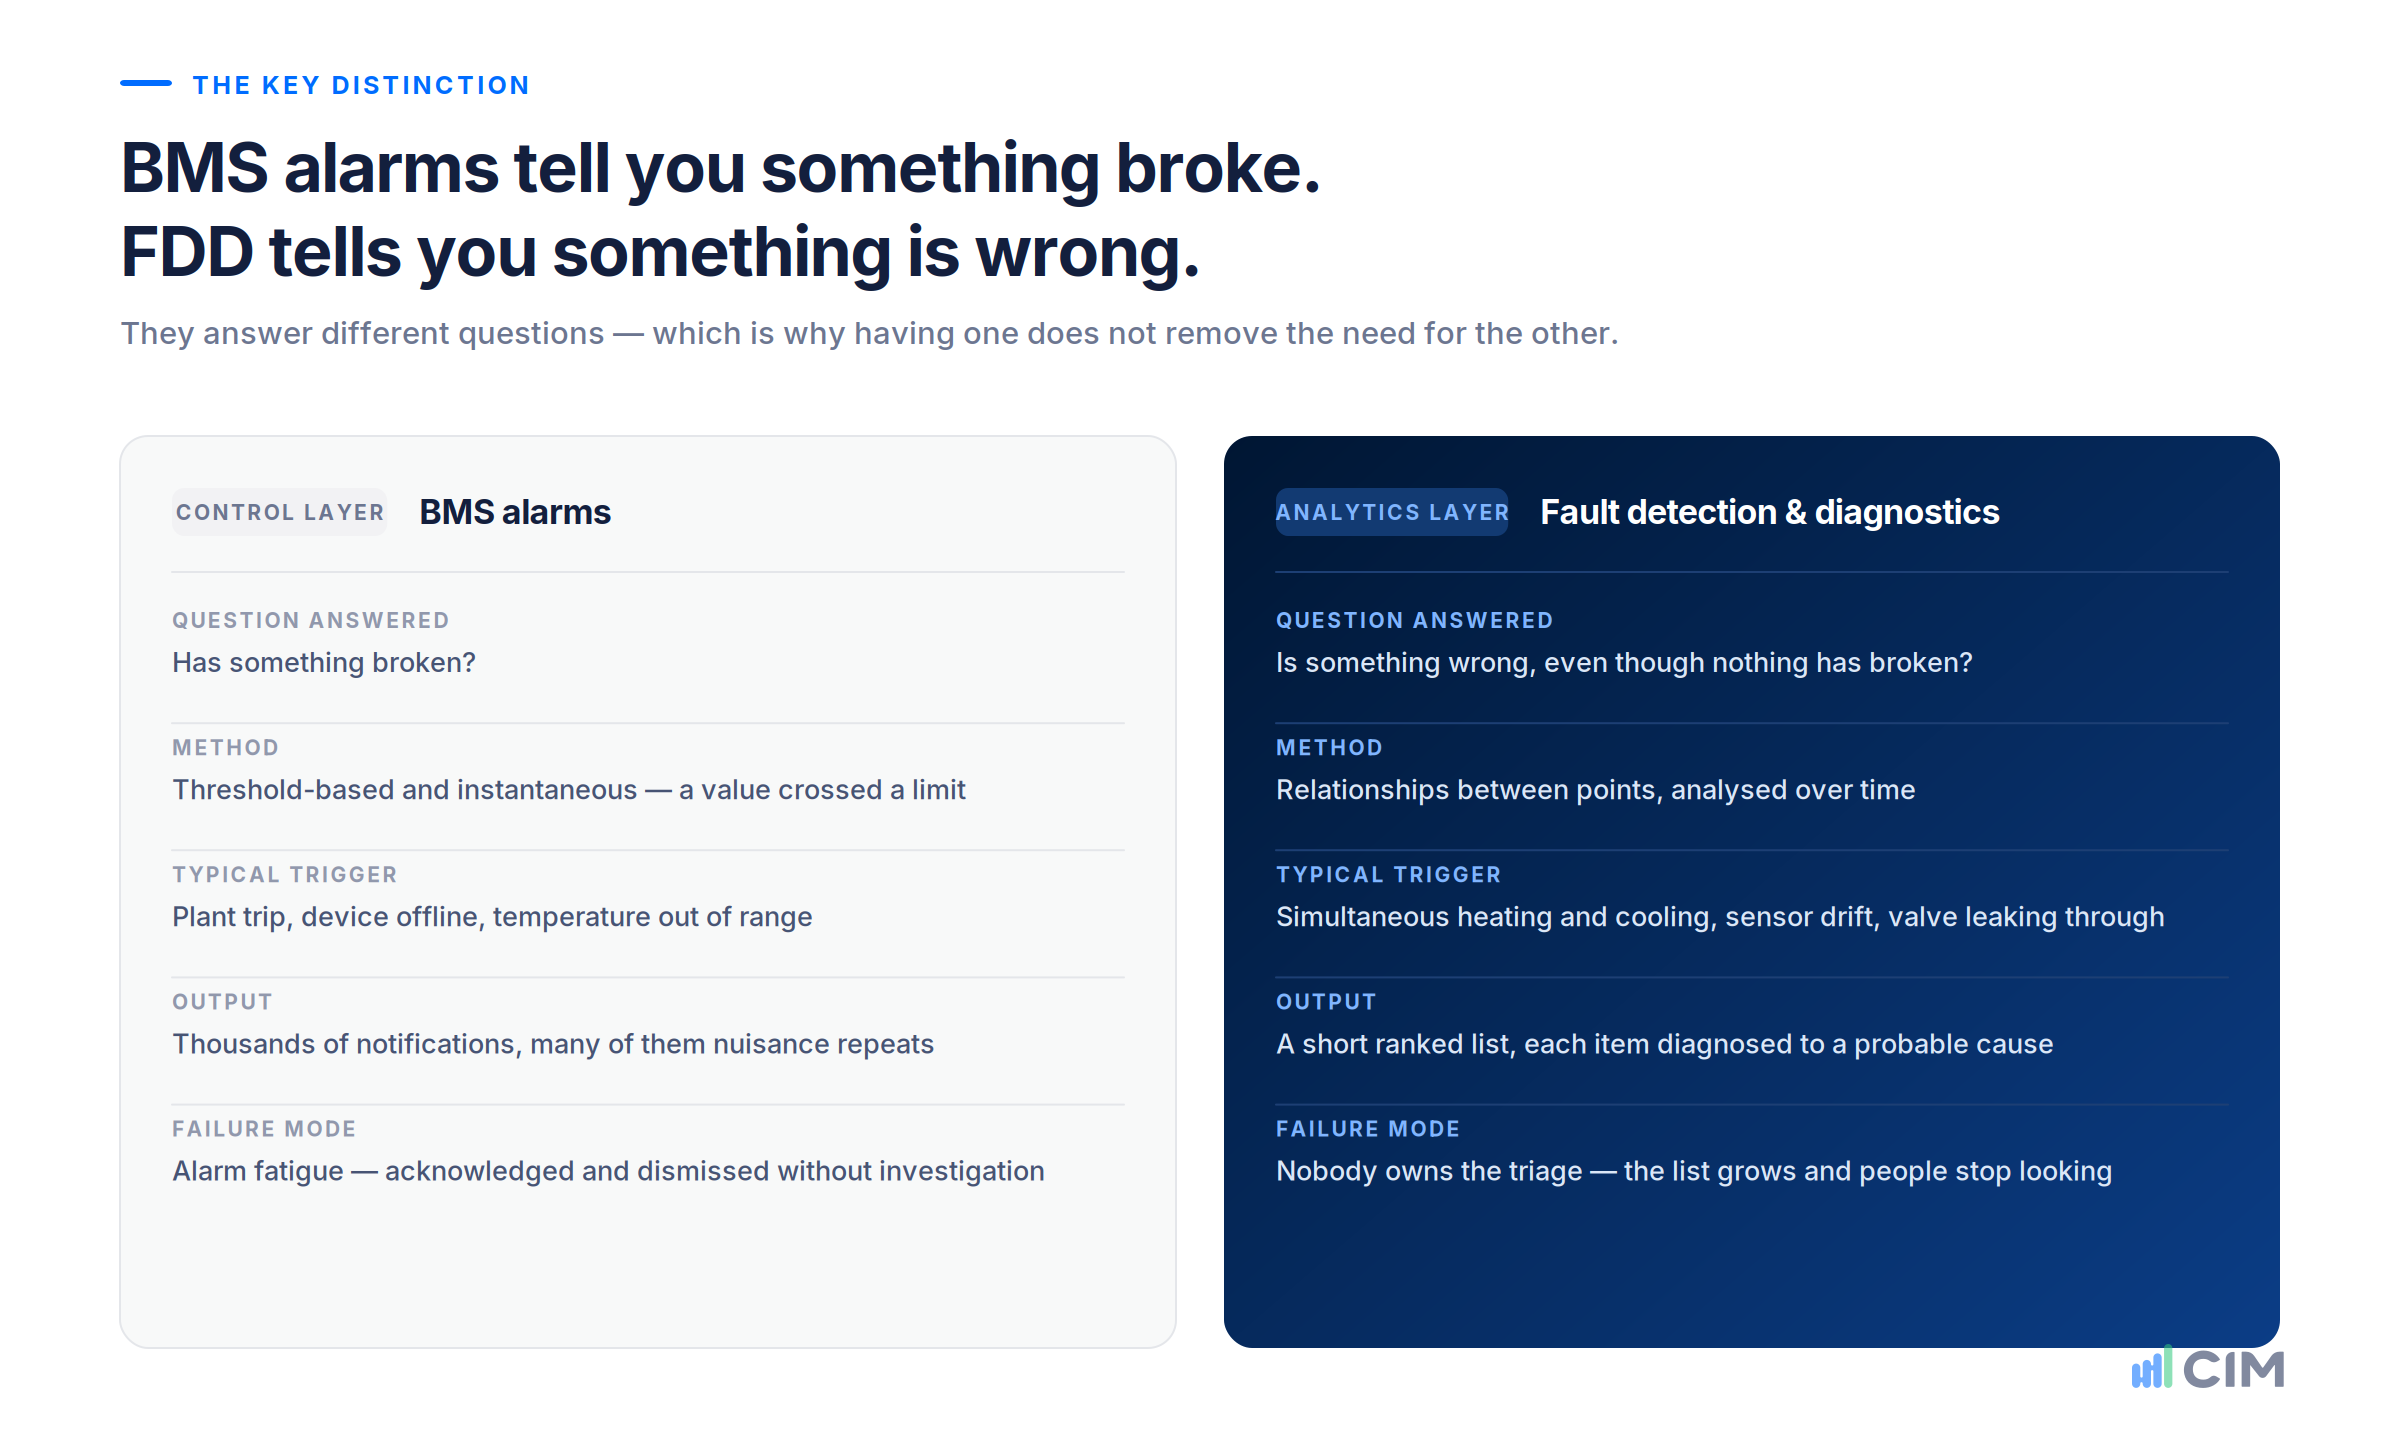
FDD looks at relationships between points over time. It tells you something is wrong even though nothing has broken: heating and cooling running simultaneously, a sensor drifting slowly out of calibration, equipment running outside occupied hours, a control loop hunting, a valve leaking through when commanded closed. None of these cross a threshold. All of them cost money.
There's also a volume problem. Threshold alarms in a large portfolio produce thousands of notifications, most of them nuisance repeats, which is exactly how teams end up with BMS alarm fatigue - a state where alarms are routinely acknowledged and dismissed without investigation. FDD done well moves in the opposite direction: fewer items, each diagnosed and ranked, each worth someone's time.
Third: FDD is not simply “a BMS module”
Most major BMS vendors now offer an analytics product alongside their control system. These can be useful, particularly on a single-vendor site. Three questions separate a genuine FDD capability from a dashboard with a new name:
- Does it work across vendors? A portfolio with Siemens, Schneider, Honeywell and Trend sites needs one fault list, not four. Vendor-native analytics rarely cross that boundary well.
- Does it diagnose, or only visualise? Trend graphs and energy dashboards are not diagnostics. The test is whether the output names a probable cause.
- Is the fault library configurable to your plant? Fixed libraries produce noise on non-standard plant, and non-standard plant is most plant.
The two layers are complementary. FDD without a BMS has almost no data to work with; a BMS without FDD has almost no visibility of its own performance.
FDD vs DDM: the engine and the operating model
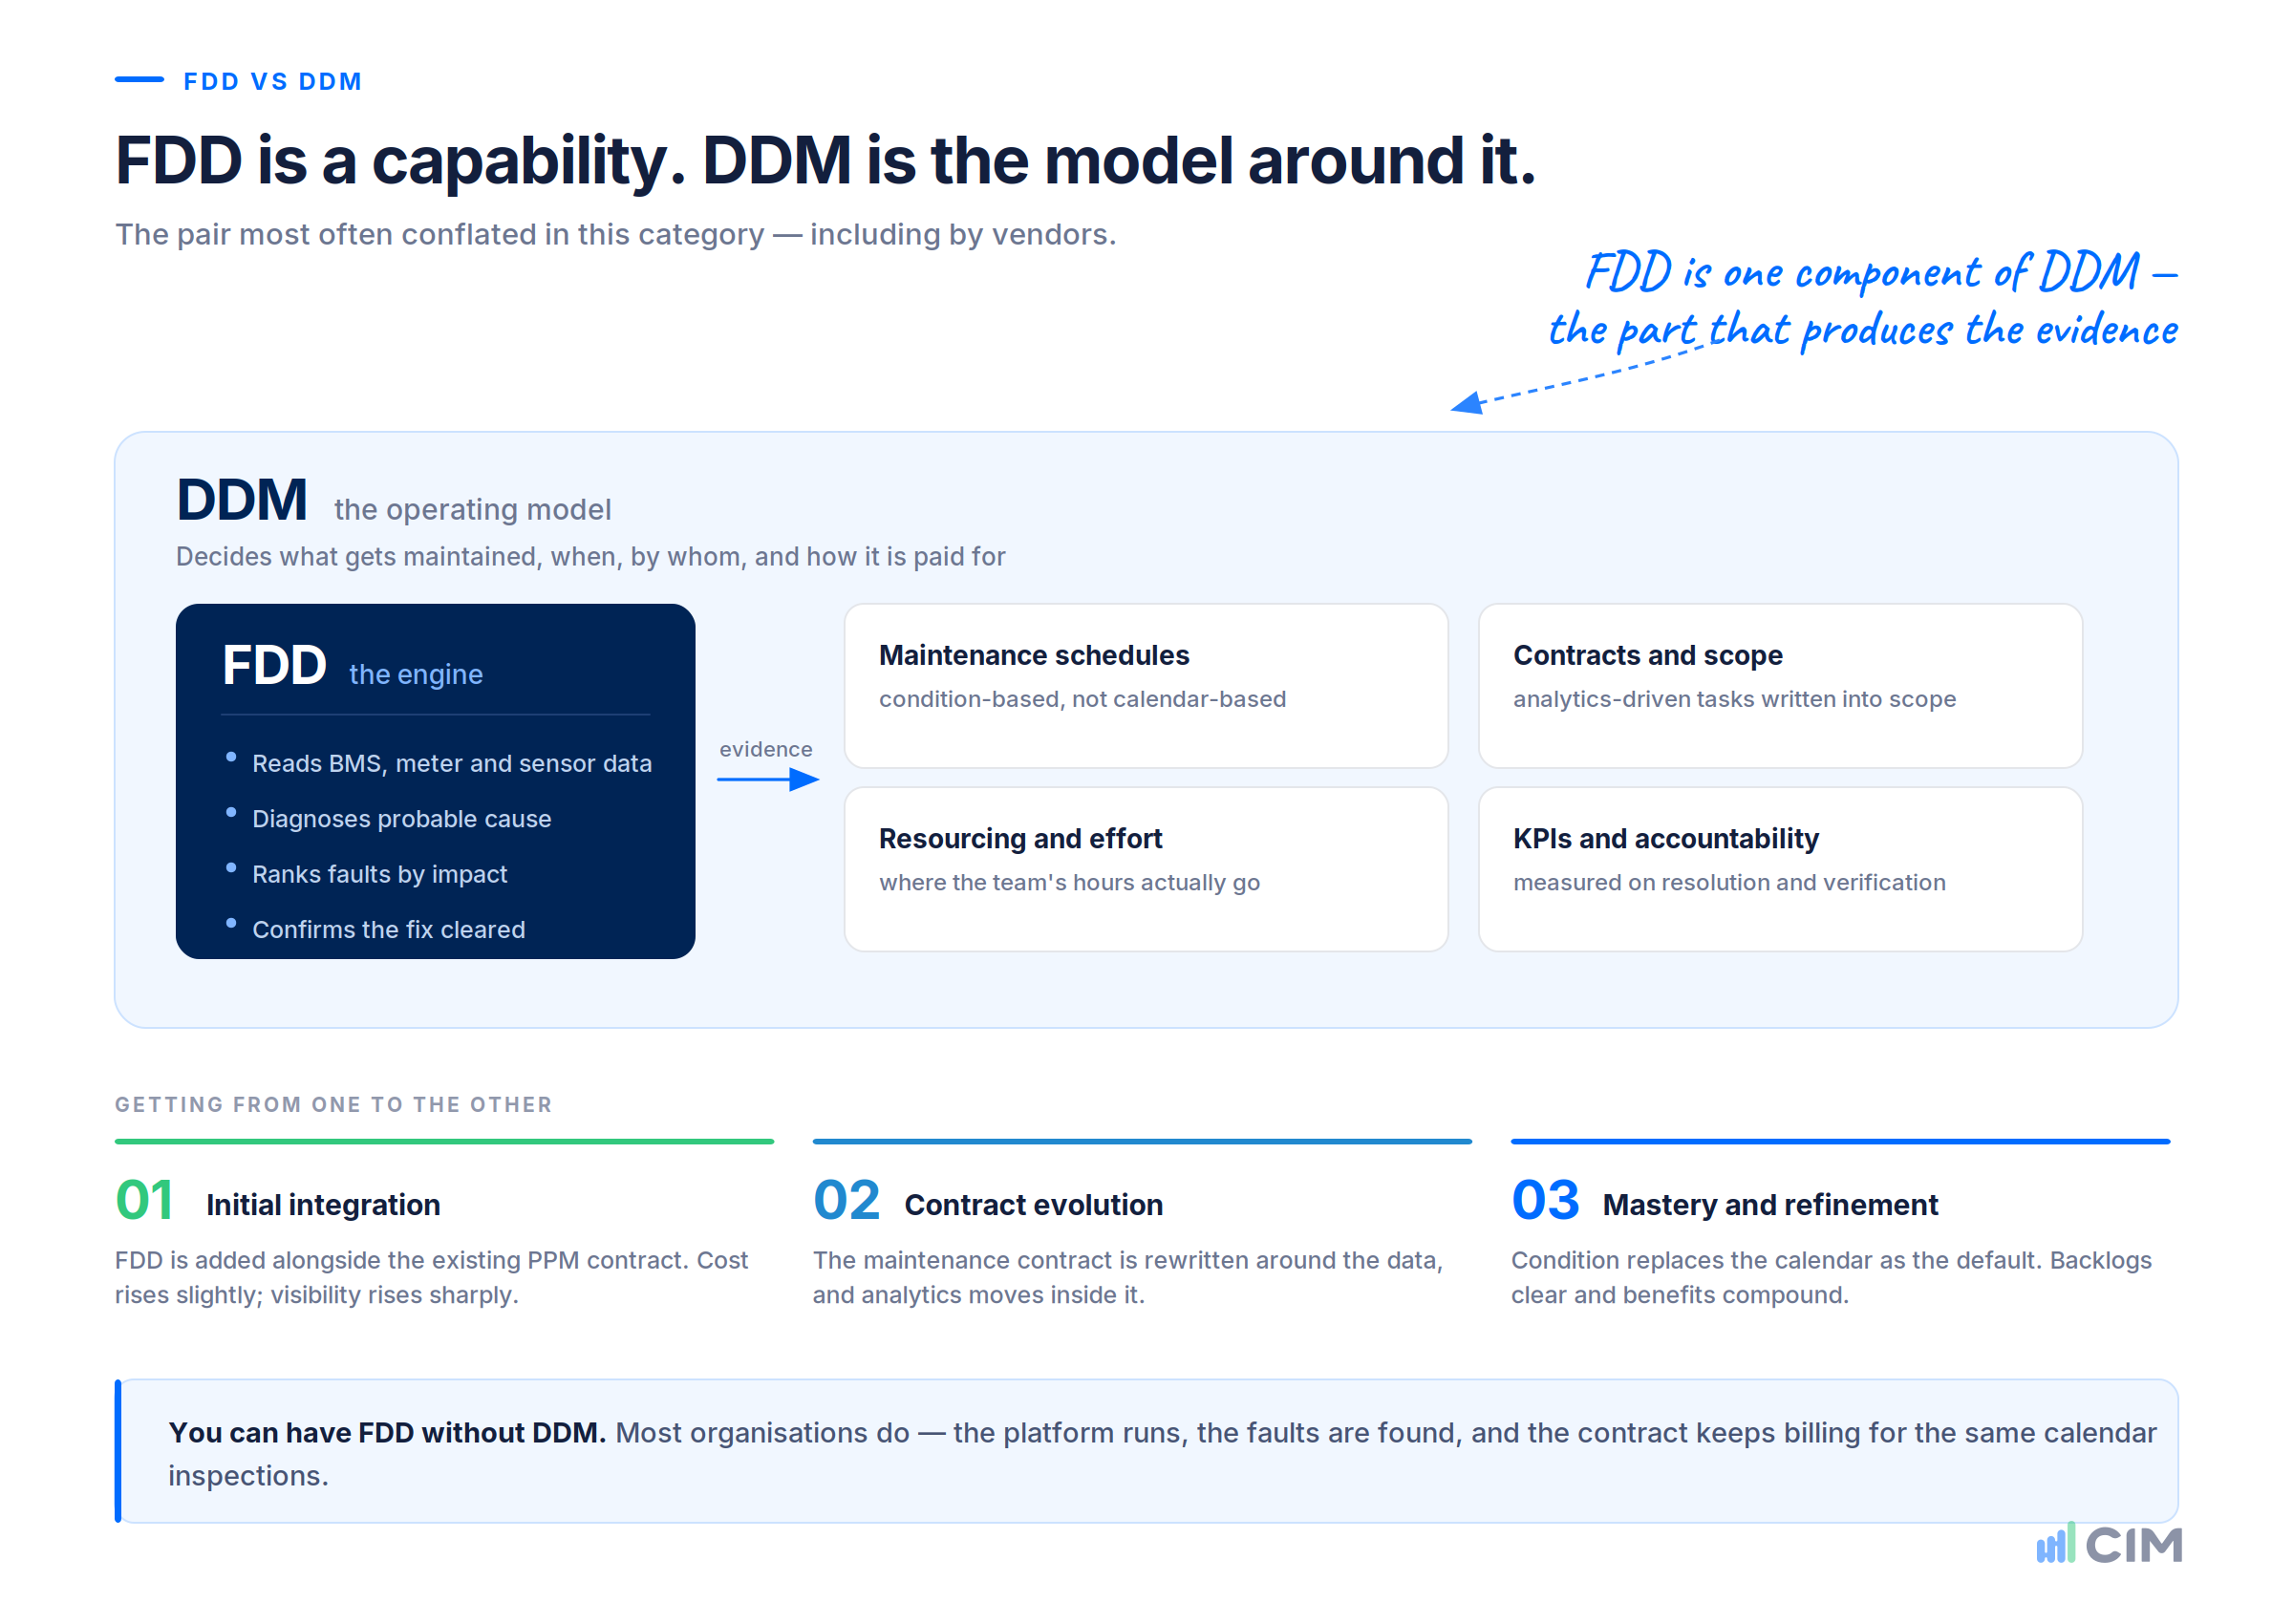
These two get conflated more than any other pair in the category, including by vendors. The distinction is simple once stated: FDD is a capability. DDM is an operating model.
Fault detection and diagnostics is software that finds and diagnoses problems. Data-driven maintenance is what an organisation does when it restructures its maintenance strategy - schedules, contracts, resourcing and KPIs - around the evidence that software produces.
You can have FDD without DDM. Plenty of organisations do: the platform runs, the faults are found, and the maintenance contract continues to bill for the same calendar-based inspections it always did. That is where most of the available value is left behind.
| FDD | DDM | |
|---|---|---|
| What it is | A software capability | A maintenance strategy and contract model |
| Scope | Finds and diagnoses faults | Decides what gets maintained, when, by whom, and how it is paid for |
| Typical owner | Operations or engineering | Asset management, procurement and operations jointly |
| Question answered | What's wrong right now? | Where should our maintenance effort and budget go? |
| Replaces | Nothing - it is additive | Calendar-based PPM as the primary planning mechanism |
| Time to value | Weeks | One to two contract cycles |
| Evidence of success | Faults found, diagnosed, resolved and verified | Fewer routine callouts, renegotiated contracts, longer asset life, less downtime |
How they relate
DDM depends on FDD. Without continuous fault data, condition-based maintenance decisions have nothing to stand on and you are back to a calendar. FDD is the sensing mechanism; DDM is what you do with what it senses.
The move typically runs in three stages:
- Initial integration. Analytics and FDD are added alongside the existing PPM contract. Costs rise slightly; visibility rises sharply.
- Contract evolution. The maintenance contract is rewritten around the data. Routine inspection frequency drops, analytics-driven tasks take their place, and the analytics cost moves inside the core contract.
- Mastery and refinement. Data-driven maintenance becomes the default planning mechanism. Backlogs clear, and cost, downtime and asset-life benefits compound.
Because the second stage requires a contract negotiation, DDM is generally a 12 to 24 month journey rather than a deployment. FDD delivers value long before that; DDM is what makes the value structural.
A related distinction: FDD vs predictive maintenance
Predictive maintenance forecasts when an asset will fail so it can be serviced beforehand. FDD identifies what is wrong now. Both sit on the spectrum away from purely preventive maintenance schedules, and both feed DDM - but they answer different questions and neither substitutes for the other. Most portfolios get considerably more value from FDD first, because current faults are more numerous, more certain and cheaper to act on than predicted future ones.
How FDD relates to the rest of the building technology stack
FDD is best understood as the analytics layer between the system that runs the building and the system that manages the work.
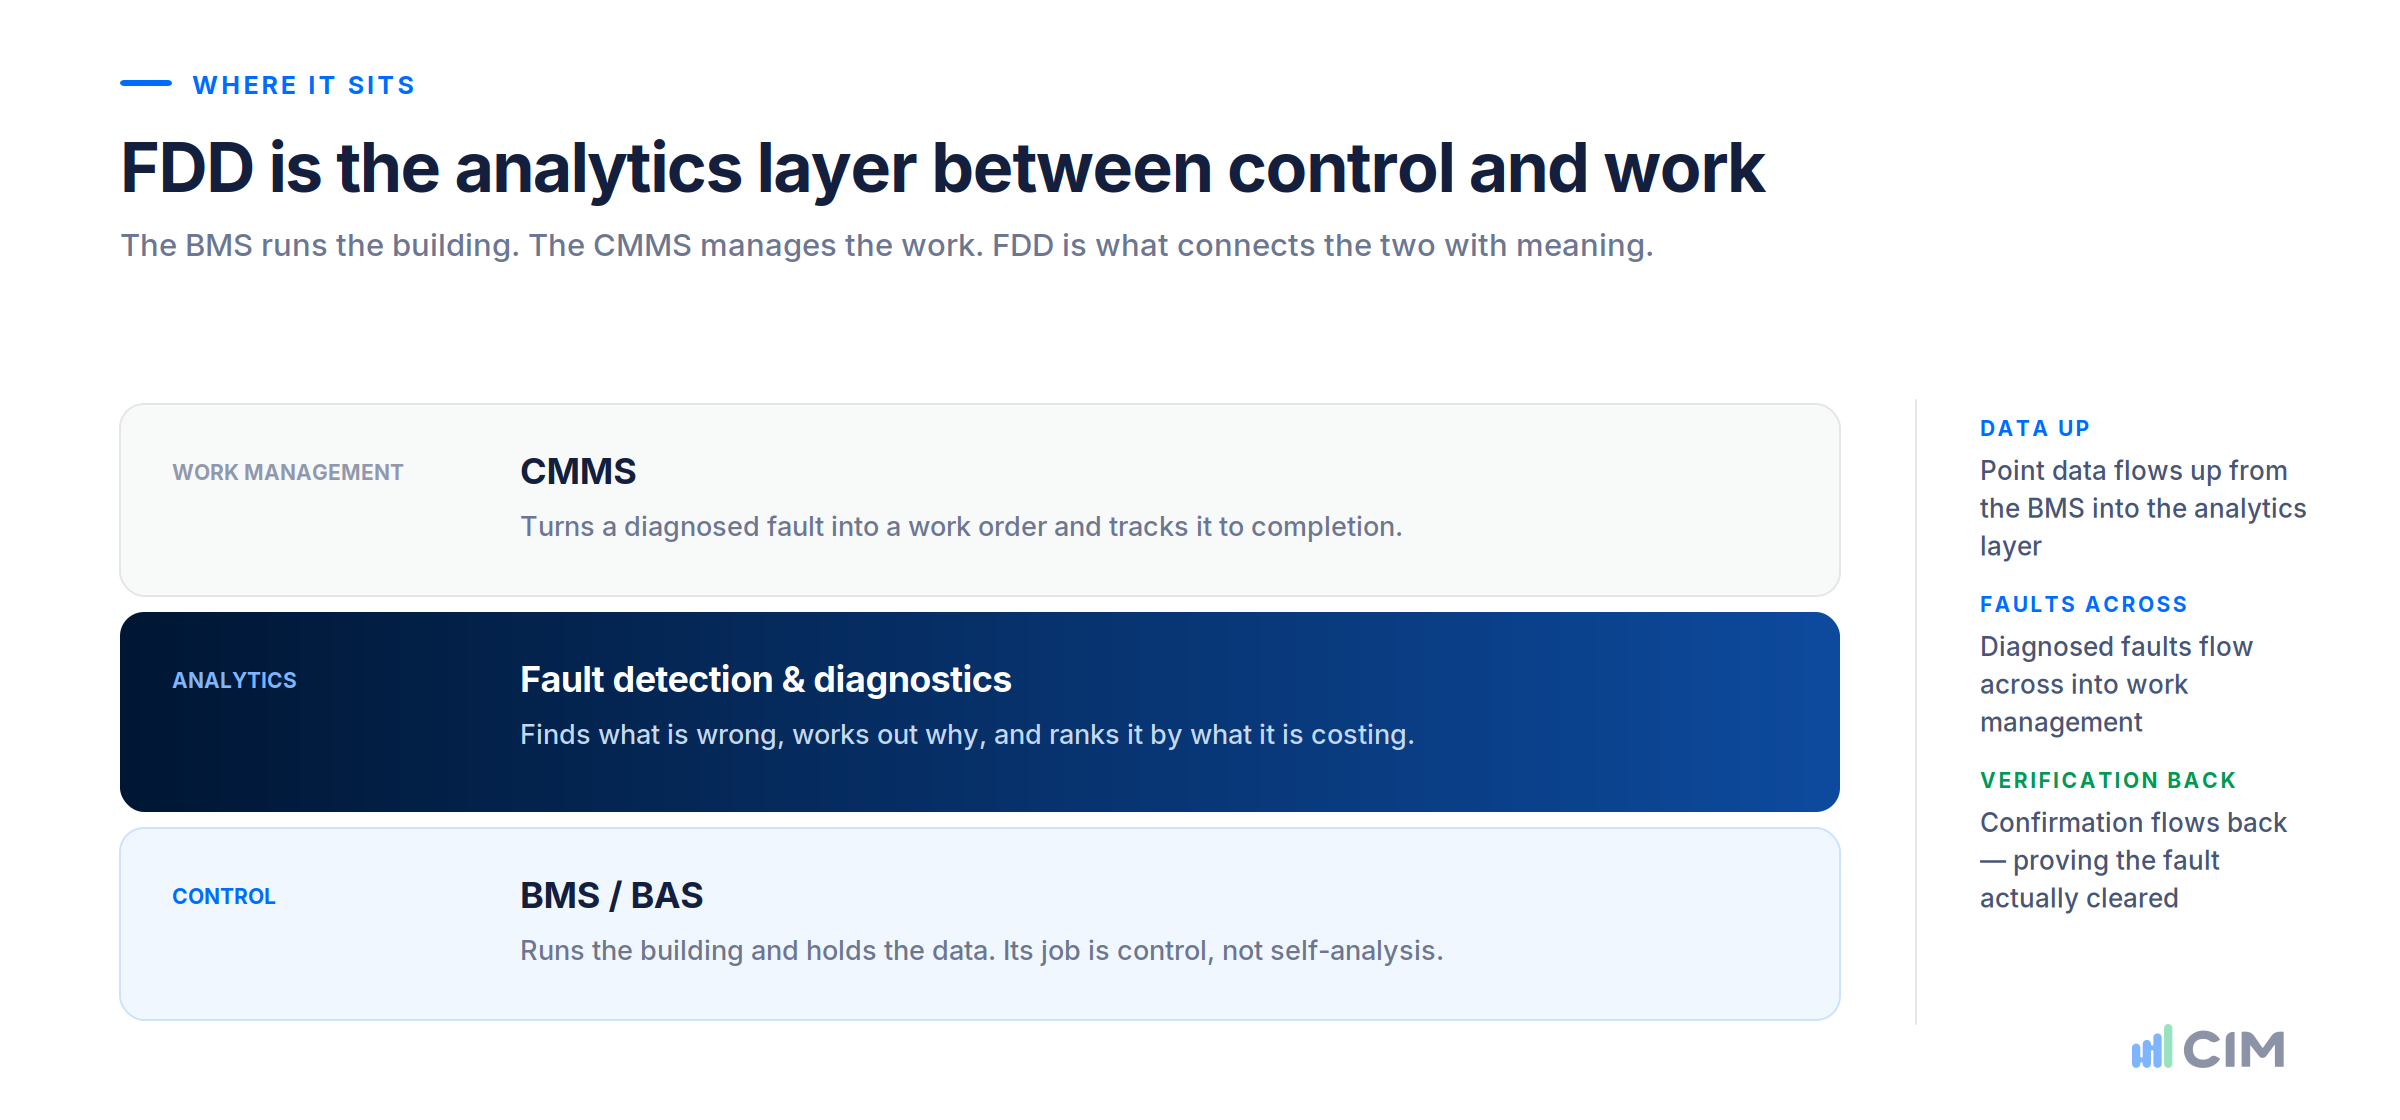
CMMS. The work management layer. It tracks work orders, assets and maintenance history. FDD generates the reason for a work order; the CMMS manages its execution. They are complementary, and the integration between them is where a lot of practical value sits.
EMS / EMIS. Energy management systems focus on consumption, cost, budgeting and reporting. They tell you that consumption rose 6% last month. FDD tells you which three assets caused it. The two are frequently sold together and increasingly delivered by the same platform.
Monitoring-based commissioning (MBCx). A programme, not a product: using continuous monitoring to keep a building performing as designed, rather than commissioning once at handover and letting performance drift. FDD is the engine that makes MBCx continuous rather than periodic. Our complete guide to monitoring-based commissioning covers this in depth.
Retro-commissioning (RCx). A point-in-time exercise to restore an existing building to correct operation. FDD both accelerates an RCx engagement - the investigation phase is largely done for you - and prevents the drift that makes the next one necessary.
Digital twin. A virtual representation of the building, often used for simulation and scenario modelling. A digital twin may consume FDD outputs; it doesn't replace the diagnostic layer. A twin that models a building whose plant is carrying undetected faults models a building that doesn't exist.
IWMS and property management platforms. Portfolio-level systems for leases, space and finance. They consume FDD outputs as performance and cost data; they don't generate them.
The faults FDD typically finds
The specifics vary by plant, but a well-configured system consistently surfaces the same families of problem.
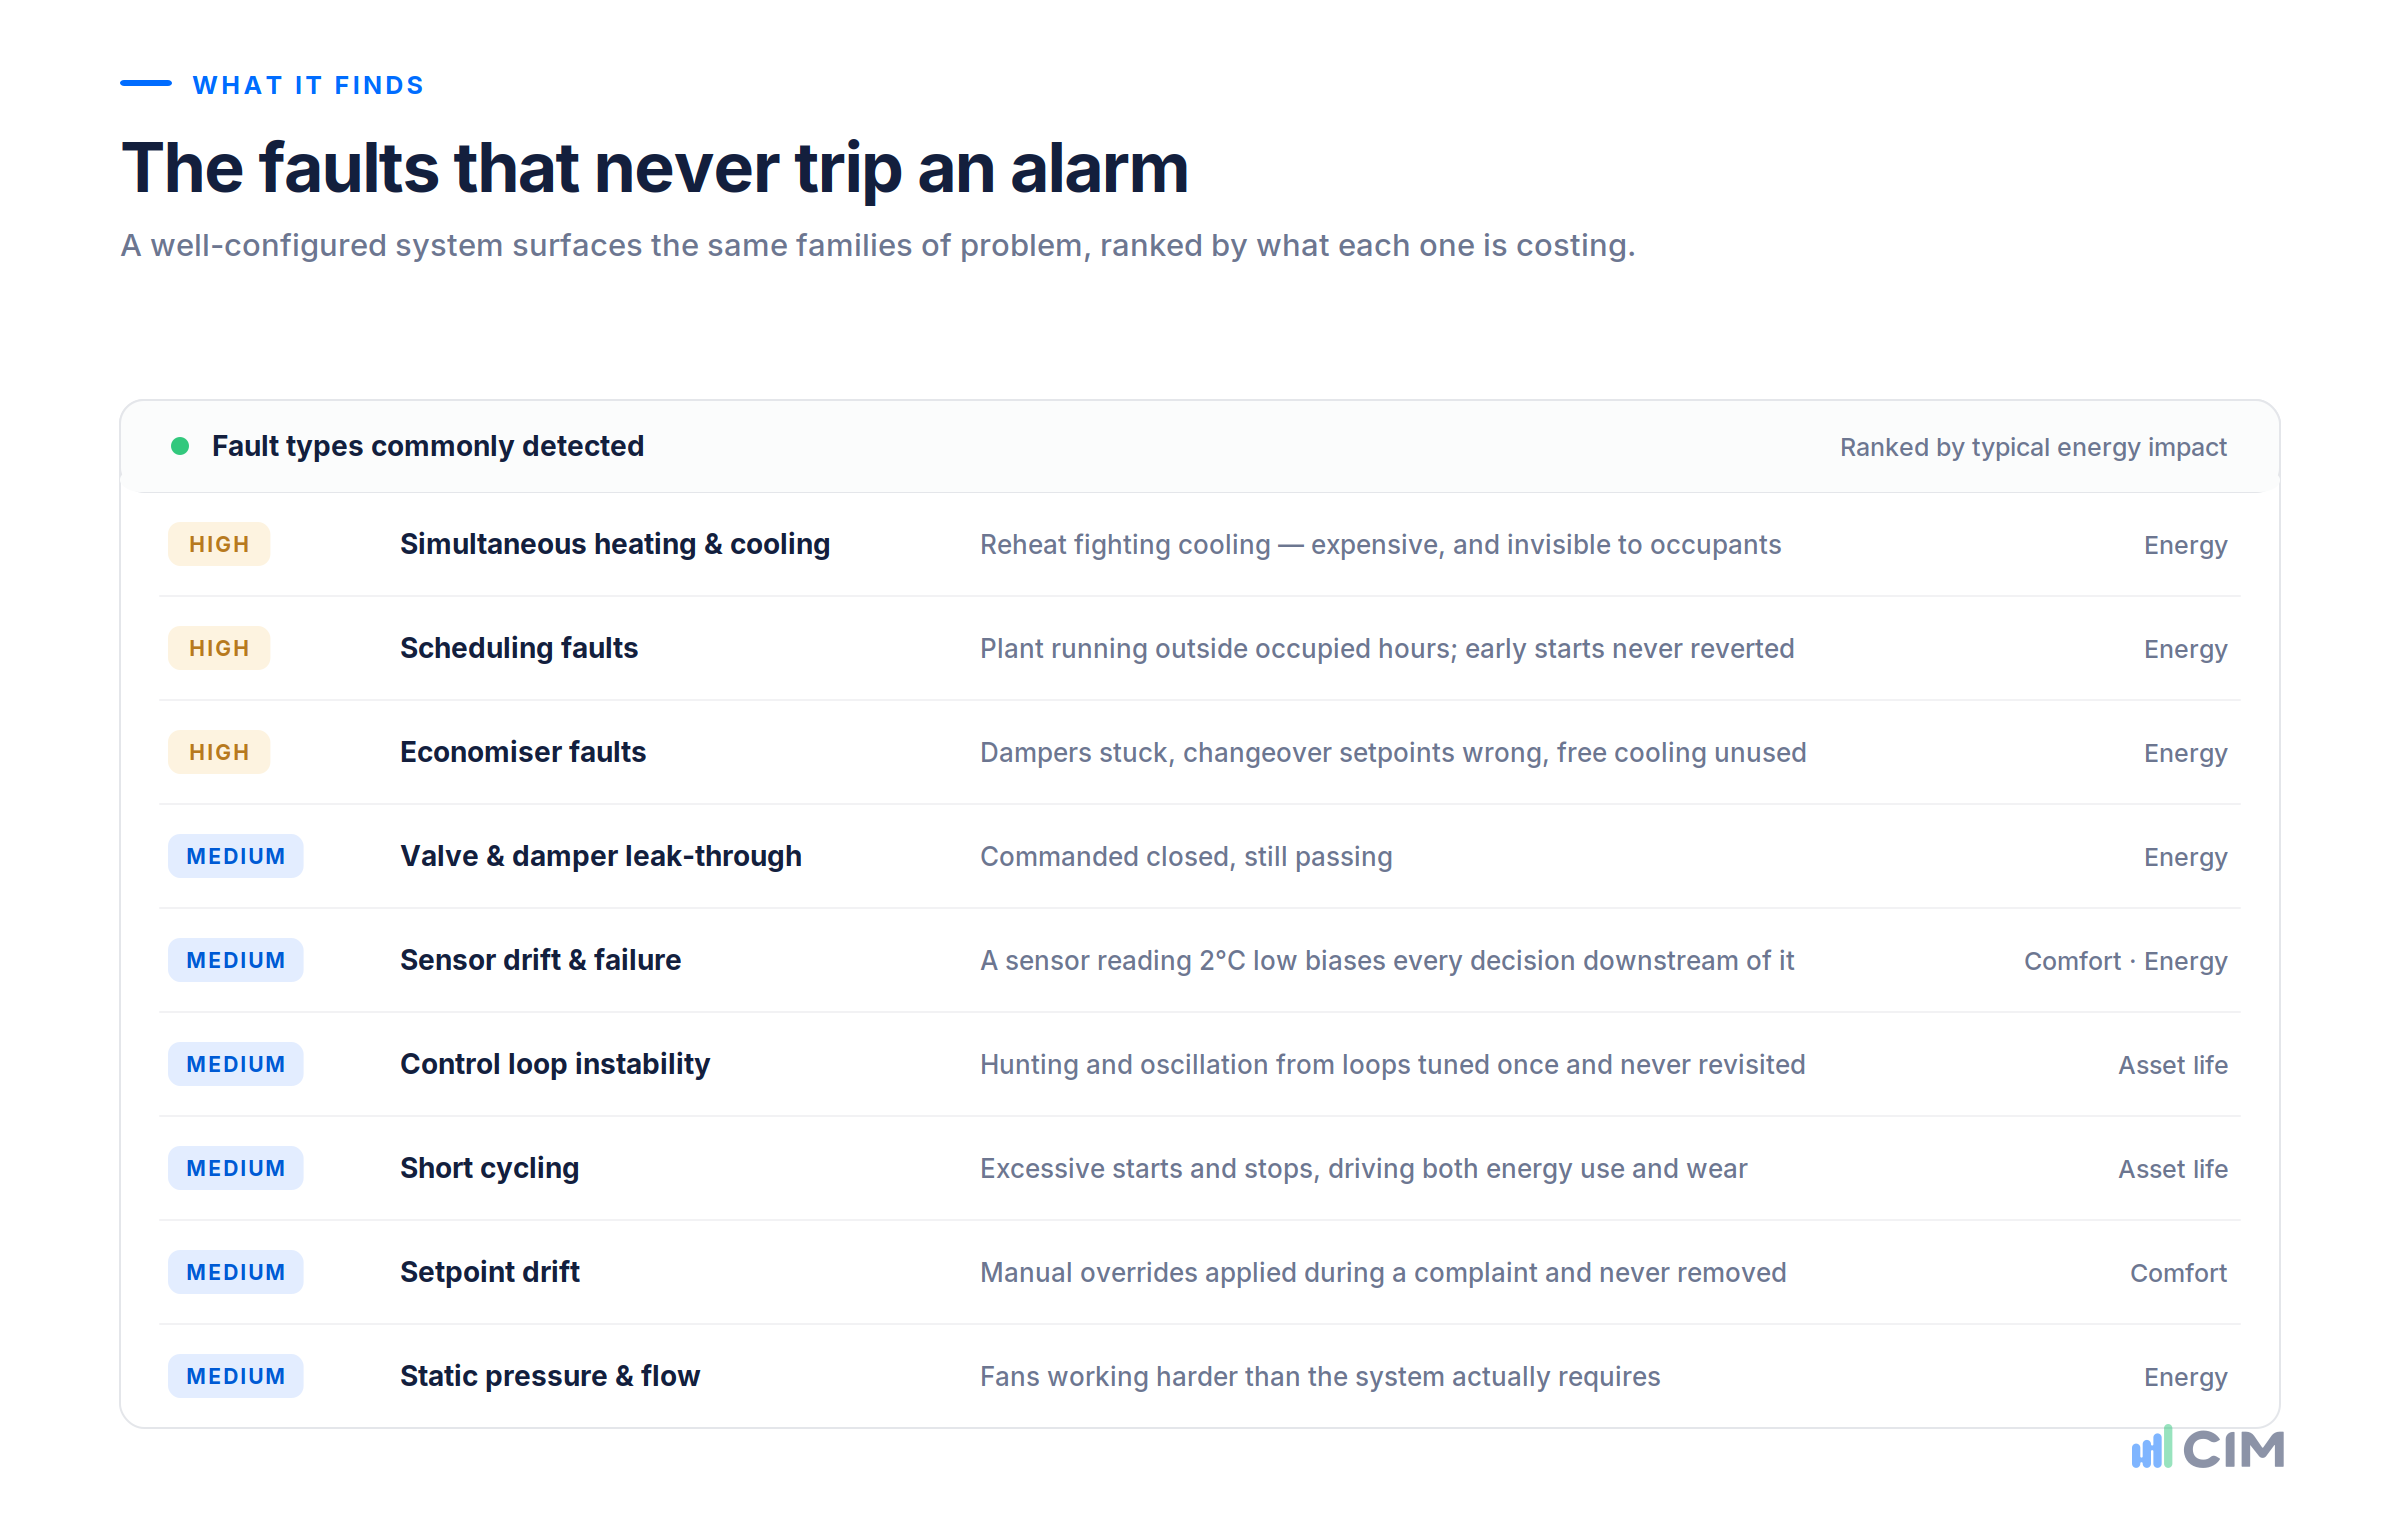
- Simultaneous heating and cooling - reheat fighting cooling, one of the most expensive faults in commercial HVAC and rarely visible to occupants
- Economiser faults - dampers stuck, changeover setpoints wrong, free cooling not being used when conditions allow it
- Scheduling faults - plant running outside occupied hours, early starts that were never reverted, holiday schedules never applied
- Sensor drift and failure - a temperature sensor reading 2°C low will quietly bias every control decision downstream of it
- Valve and damper leak-through - commanded closed, still passing
- Control loop instability - hunting, oscillation, and PID loops tuned once at commissioning and never revisited
- Setpoint drift - manual overrides applied during a complaint and never removed
- Short cycling - equipment starting and stopping excessively, driving both energy use and wear
- Static pressure and flow issues - fans working harder than the system requires
Two examples from CIM's own portfolio make the pattern concrete: a hidden fan fault in a 6-star rated building - a high-performing asset, still carrying an undetected fault - and rectifying overnight operation that drove a 33% energy reduction. Neither was visible through normal operations.
What FDD is worth: benefits and the value journey
The benchmark number
The best available benchmark comes from a Lawrence Berkeley National Laboratory study published in Building and Environment (Lin, Kramer and Granderson, 2020), which surveyed 26 organisations running FDD across 550 buildings totalling 97 million square feet. Those users achieved median energy savings of 8%.
The same study documented median costs: around US$8 per monitoring point for software implementation, US$2.70 per point in annual recurring software cost, and US$8 per point in annual labour, on a typical deployment of roughly 1,300 points. Those figures are from 2020 and should be treated as indicative rather than current, but the shape holds: FDD is a modest operating cost set against a percentage of total building energy spend.
The benefits, in the order finance teams tend to value them
1. Energy cost. The most quantifiable benefit and usually the one that funds the programme. A median 8% reduction against total energy spend is the working assumption; sites with significant scheduling or simultaneous heating-and-cooling faults often exceed it in the first year, because those faults are cheap to fix and expensive to leave.
2. Maintenance efficiency and contract cost. Technicians arrive knowing what's wrong instead of diagnosing on site. Reactive callouts fall. Routine inspections that consistently find nothing can be reduced with evidence rather than hope. This is where FDD stops being an energy project and becomes an operating-cost project.
3. Equipment downtime and asset life. Short cycling, hunting and running outside design conditions all shorten equipment life. Removing them defers capital replacement - the largest number on the list, and the hardest to book.
4. Capital planning. A ranked, evidence-based fault history tells you which assets are genuinely failing and which are simply badly controlled. That distinction routinely changes a capex plan: plant scheduled for replacement turns out to need retuning, and plant nobody was watching turns out to be the priority.
5. Comfort and tenant satisfaction. A meaningful share of comfort complaints trace back to faults that FDD detects before anyone picks up the phone. In leased assets this connects directly to retention and to indoor environment obligations under green leases.
6. Ratings and compliance. Operational ratings such as NABERS are calculated from measured consumption, so anything that removes waste feeds directly into the rating. The same applies to energy performance obligations under schemes like EPC/MEES in the UK and building performance standards in the US.
7. Contractor accountability. Continuous monitoring makes it visible whether work was completed and whether it worked - a recurring theme in portfolios that use FDD data in contractor reviews.
8. Reporting and disclosure. Verified, asset-level performance data is increasingly required rather than requested - for ESG reporting, green lease compliance, tenant Scope 3 requests and green finance covenants.
The value journey: what happens, and when
Value from FDD does not arrive as a single step. It arrives in stages, and knowing which stage you are in prevents both impatience and complacency.
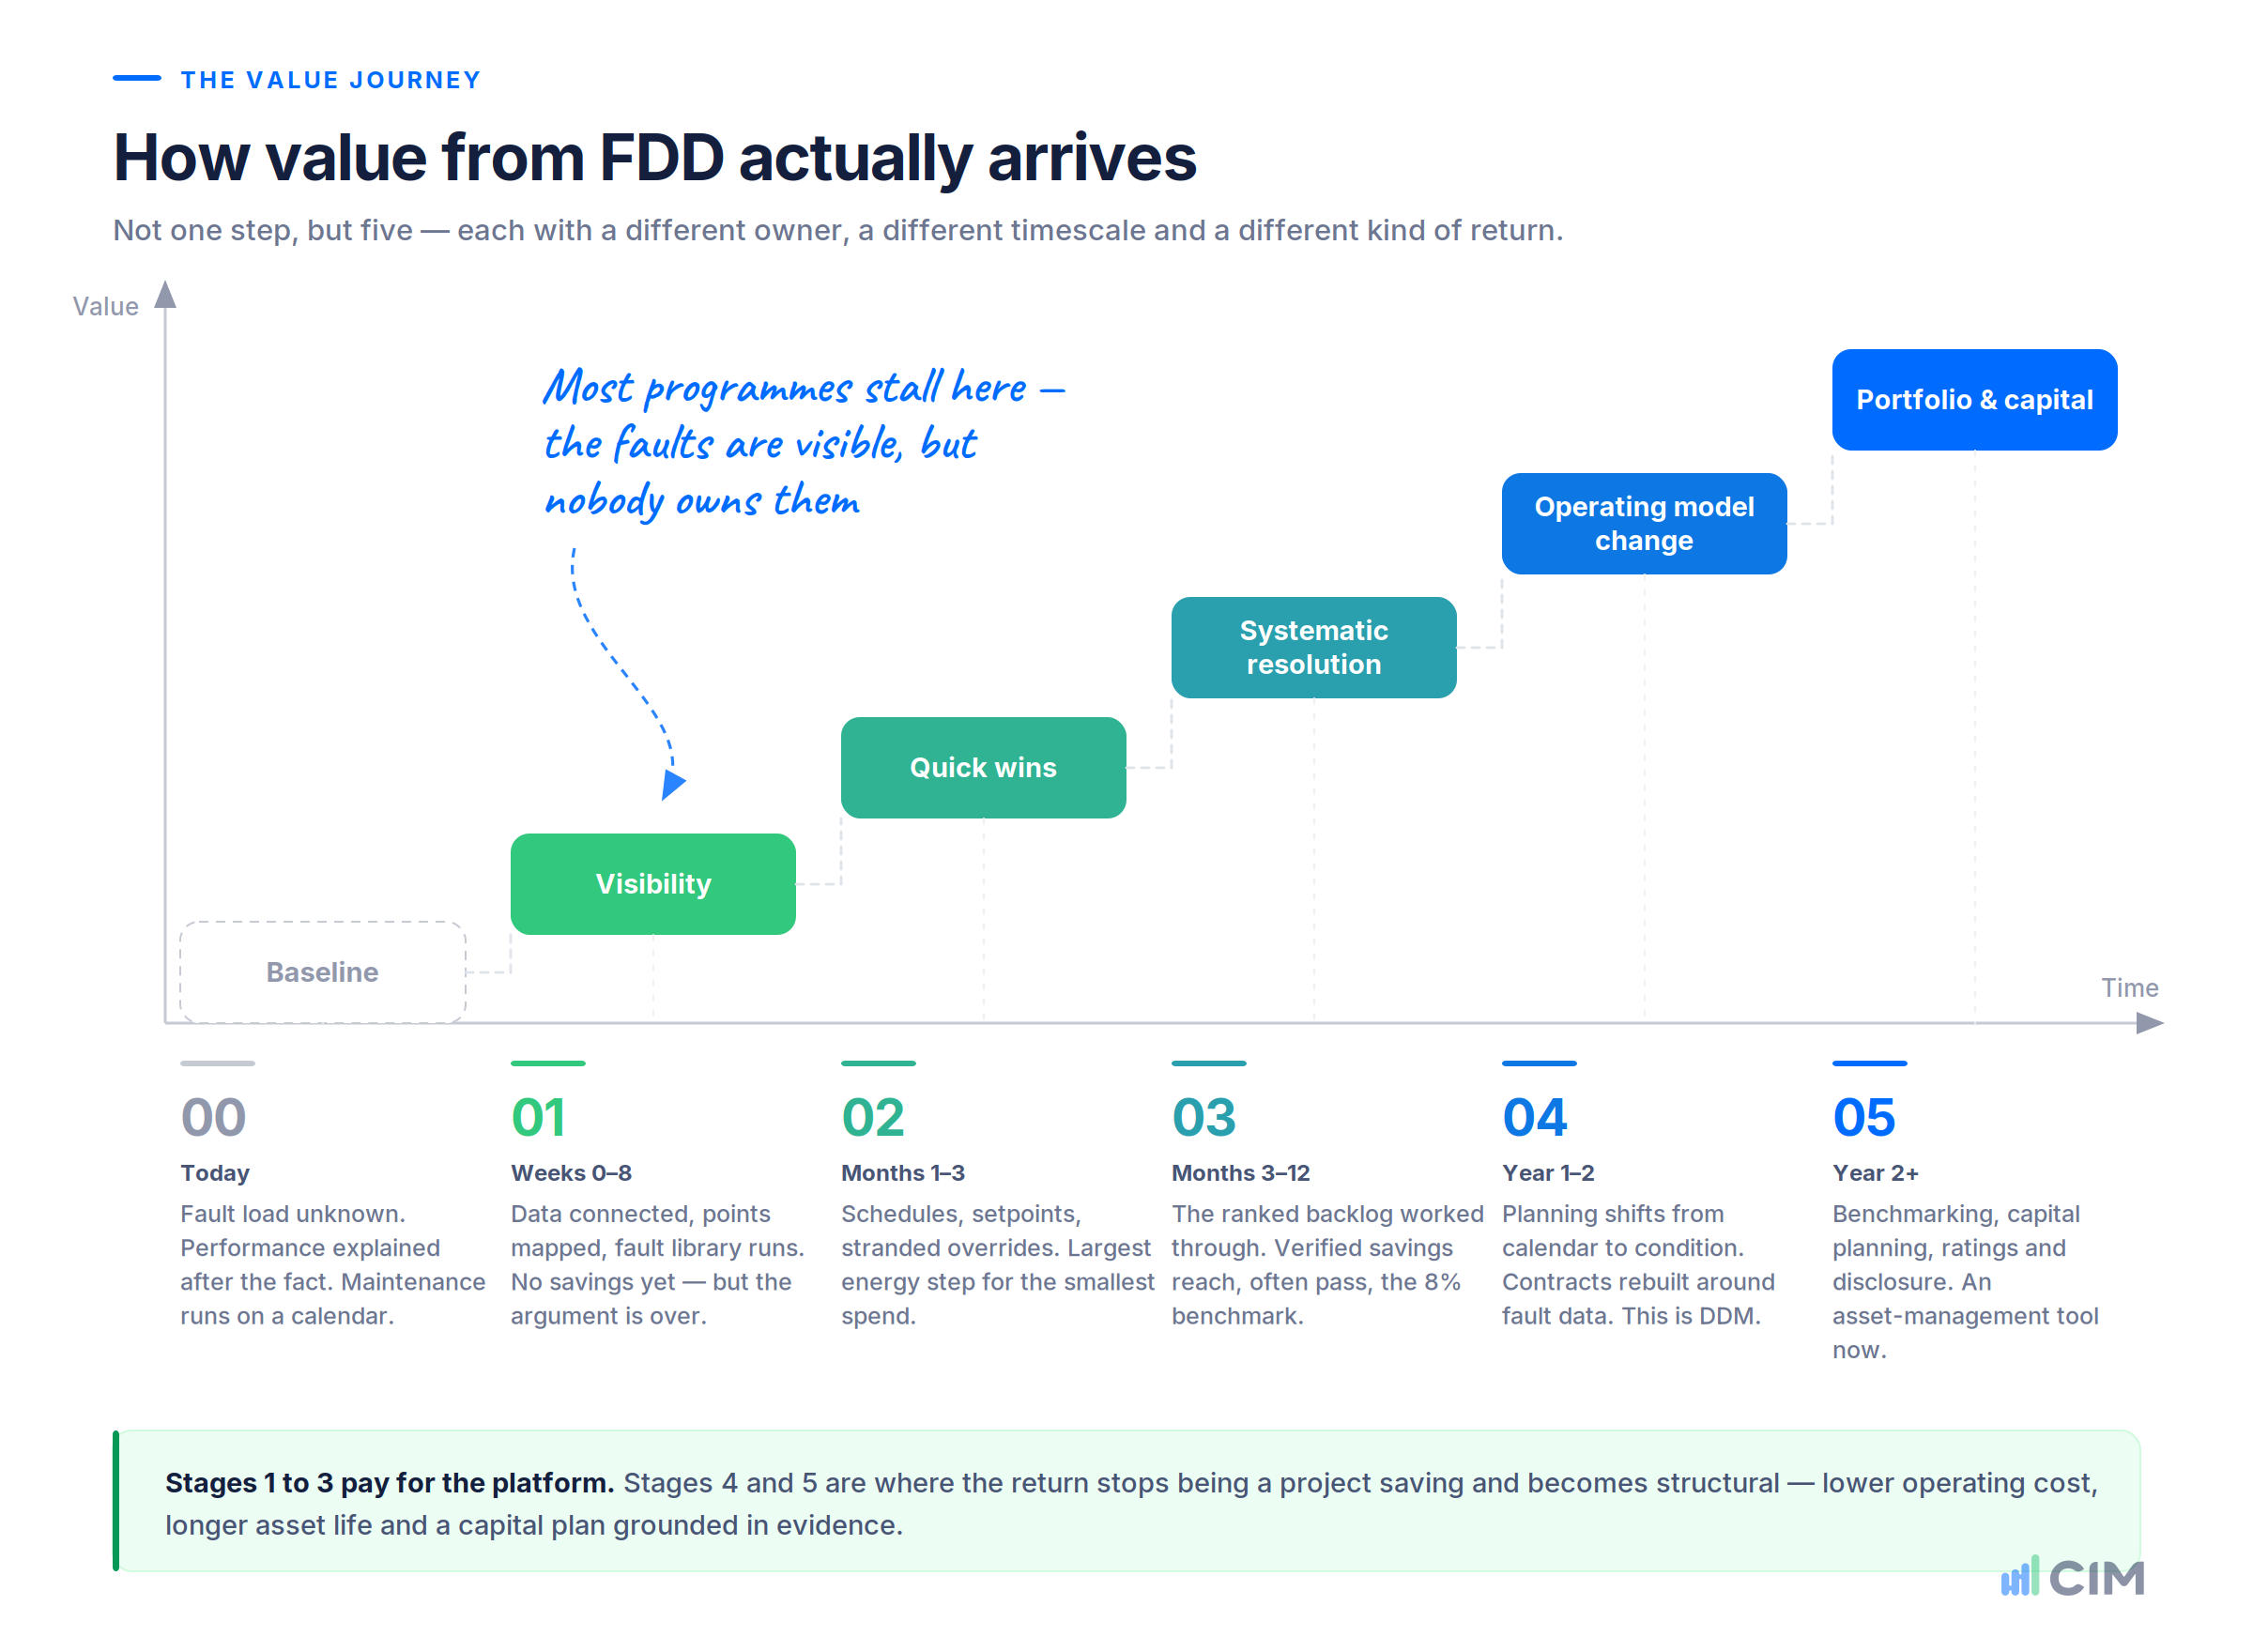
Stage 0 - Baseline (before you start). You don't know your fault load. Energy performance is explained after the fact by weather, occupancy and “the plant's getting old”. Maintenance is calendar-driven. This is the state that 40%-of-AHUs-have-a-fault describes.
Stage 1 - Visibility (weeks 0–8). Data is connected, points are mapped, the fault library runs for the first time. The output is uncomfortable: most sites find substantially more open faults than expected. No savings yet - but the argument about whether there is a problem is over.
Stage 2 - Quick wins (months 1–3). Schedules, setpoints, stranded overrides, economiser changeover, simple control faults. These are no-cost or low-cost fixes made from a keyboard or in a single site visit. This stage typically delivers the largest single step in energy performance for the smallest spend, and is what pays for the platform.
Stage 3 - Systematic resolution (months 3–12). The ranked backlog is worked through: mechanical faults requiring parts, contractor jobs, sensor recalibration and replacement. Resolution rate becomes the metric that matters. Verified savings accumulate towards, and often past, the 8% benchmark. Rules are tuned as false positives are eliminated.
Stage 4 - Operating model change (year 1–2). Maintenance planning shifts from calendar to condition. Contracts are renegotiated around fault data. Contractor performance is measured against resolution and verification, not attendance. This is the transition from FDD to data-driven maintenance, and it is where operating-cost benefits become structural rather than opportunistic.
Stage 5 - Portfolio and capital (year 2+). Assets are benchmarked against each other, which changes where effort goes. Fault history informs the capital plan. Ratings improve as a by-product of clean operation. Verified performance data supports disclosure, green finance and leasing. Analytics stops being an operations tool and becomes an asset-management one.
Most programmes that fail do so between Stage 1 and Stage 2 - the faults are visible, and nobody owns them.
Integrating FDD with an existing BMS and legacy infrastructure
This is the question that stalls most FDD projects, and the honest answer is reassuring: FDD is overwhelmingly deployed on existing buildings with existing, often ageing, control systems. That is the normal case, not the difficult one. New-build deployments are the exception.
FDD does not require you to replace your BMS. It requires read access to the data your BMS already holds.
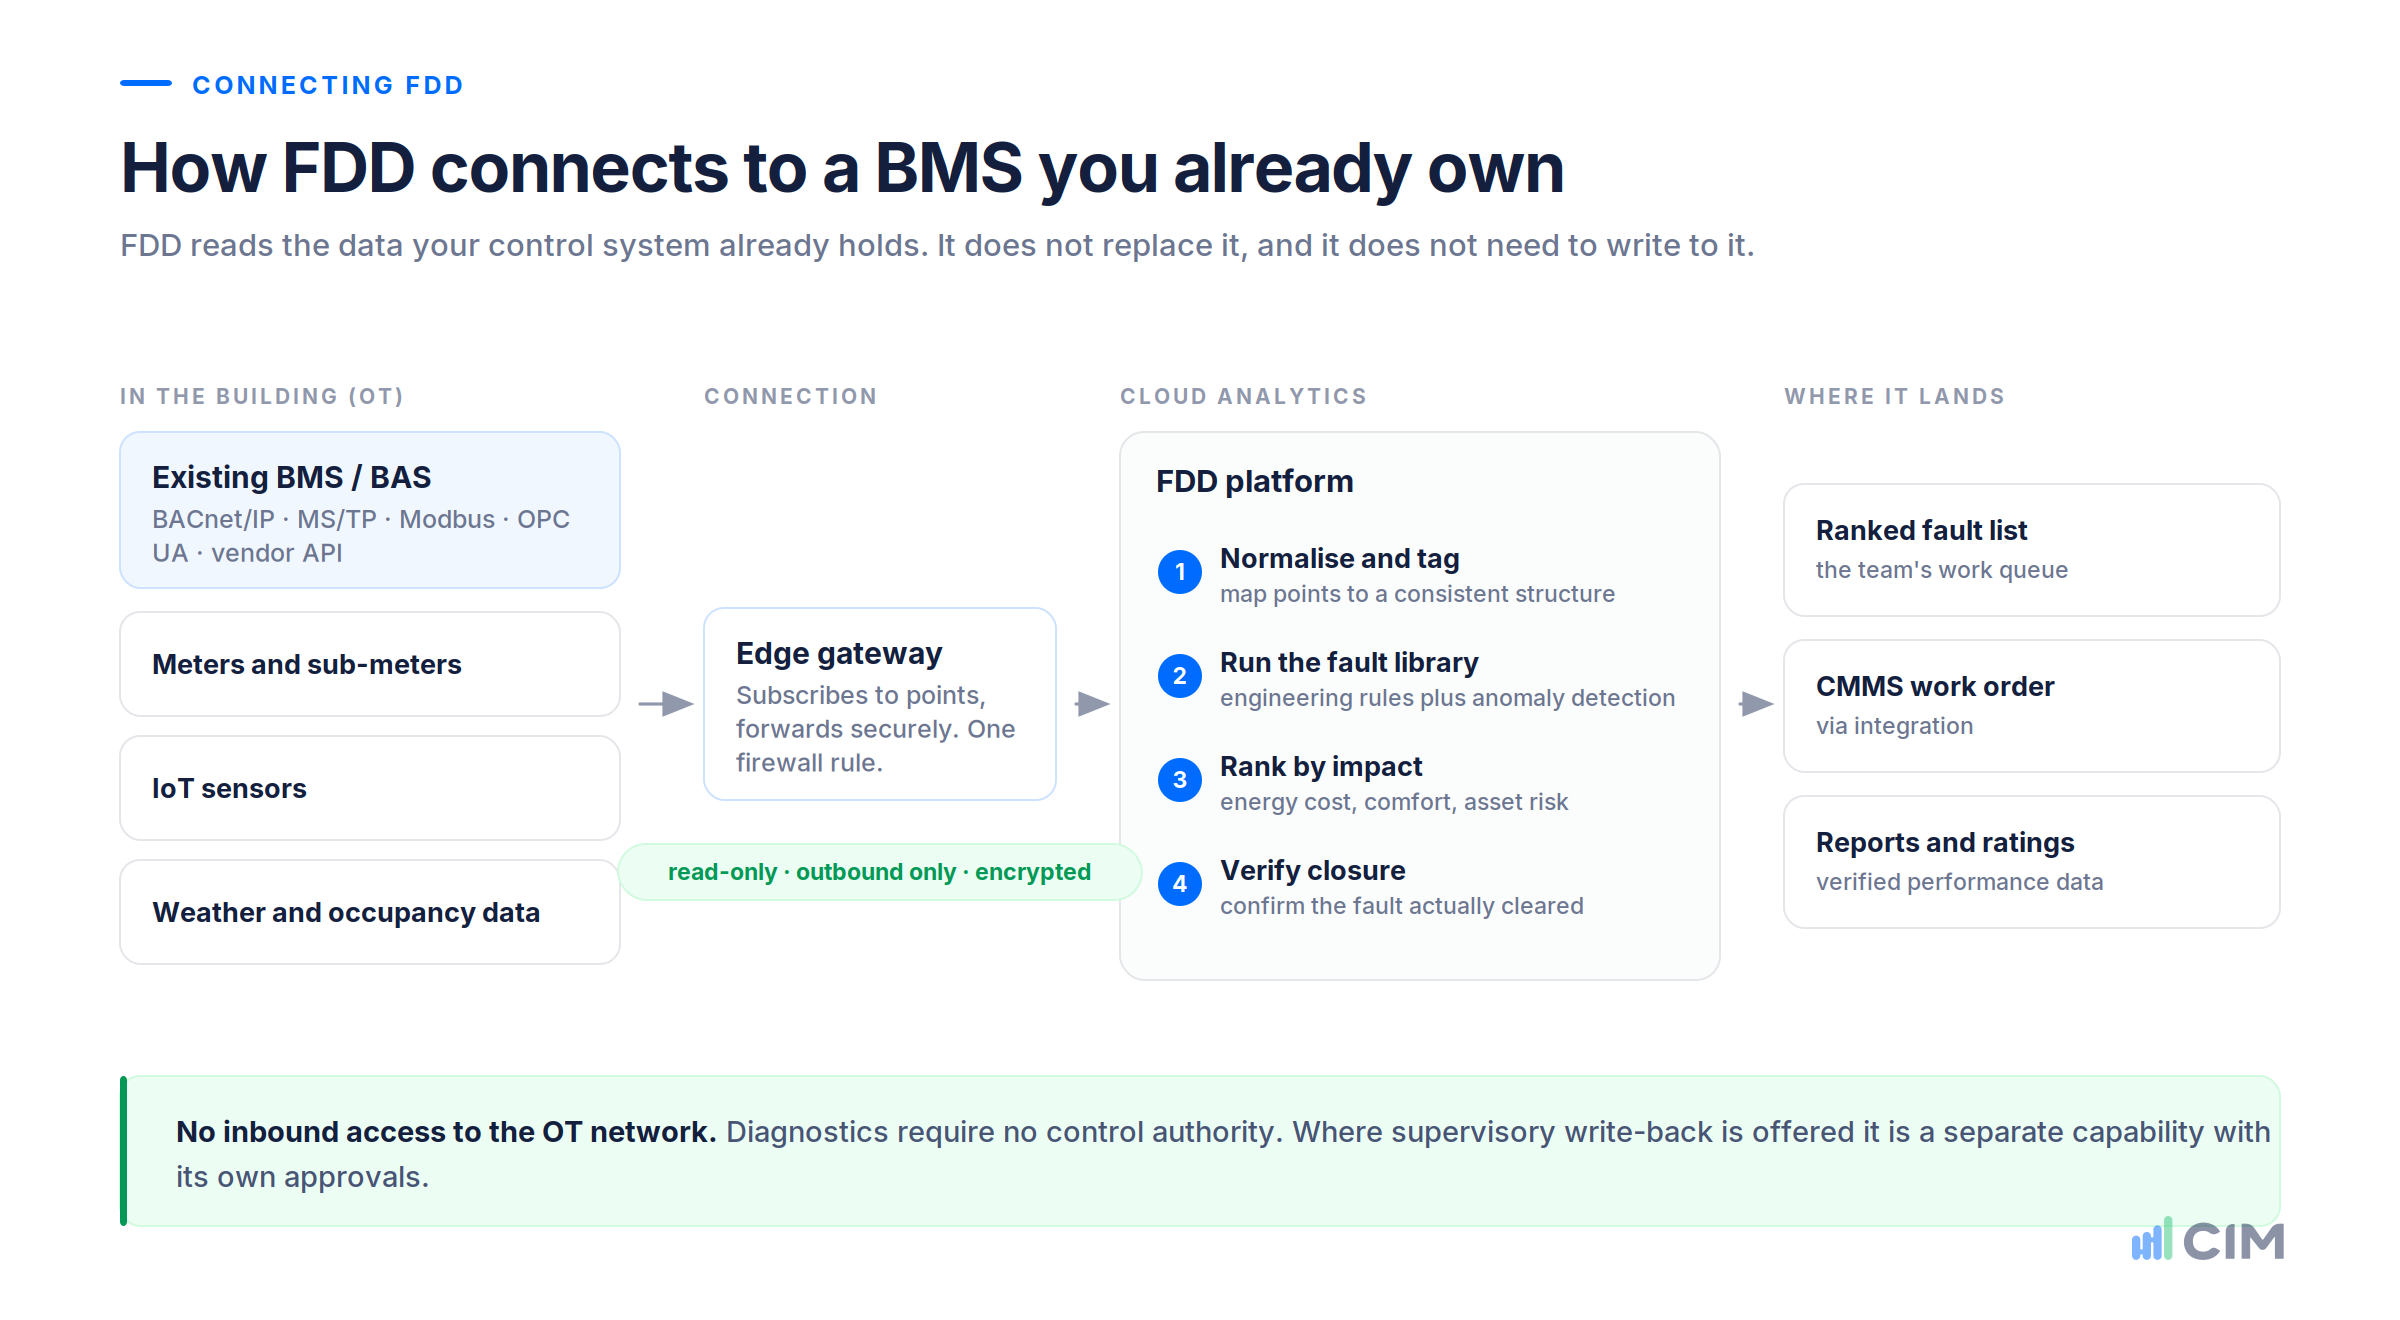
What FDD actually needs
| Requirement | Typical target | Notes |
|---|---|---|
| Read access to BMS points | Read-only | No control authority is needed for diagnostics |
| Data frequency | Every 5–15 minutes | Hourly data hides most control faults |
| Point coverage | Several hundred to several thousand per building | Sensors, setpoints, commands and status - not just sensors |
| Historical depth | 3–12 months if available | Speeds up baselining; not a blocker |
| Network path out | Outbound, encrypted | Usually one firewall rule |
Note the second row more than the others. Many BMS installations trend data hourly, or only on change of value. Increasing trend frequency is usually a configuration change, but it needs to be scoped early because it affects controller storage and network load.
How the connection is usually made
- BACnet/IP - the most common path. An on-site gateway or software client subscribes to points on the BMS network.
- BACnet MS/TP - serial networks on older or distributed sites, reached via a BACnet router or an edge gateway.
- Modbus TCP / RTU - typically for plant-level equipment: chillers, generators, meters, variable speed drives.
- OPC UA - more common on campus, industrial and mixed OT environments.
- Vendor APIs and integration licences - several major BMS vendors expose data through a supervisory layer or cloud API, sometimes requiring a licence.
- MQTT and IoT sensor overlays - for equipment not on the BMS at all.
- Direct database or trend-log export - a workable fallback where live protocol access isn't permitted.
- Meter and utility data feeds - separate from the BMS, and often the first data available.
Most deployments use two or three of these at once. A mixed portfolio will use all of them.
The legacy situations you are most likely to hit
| Your situation | The usual path |
|---|---|
| Proprietary or closed BMS (older Siemens, Johnson Controls, Honeywell, Schneider, Trend, Delta, Automated Logic) | A BACnet gateway, a supervisory interface, or a vendor integration licence. Nearly always solvable; occasionally involves a licence cost worth negotiating before you sign the analytics contract. |
| Serial-only MS/TP network | A BACnet router or edge gateway bridges to IP. Standard, and inexpensive. |
| Mixed vendors across the portfolio | Normalise at the analytics layer, not by standardising the BMS estate. Replacing controllers to enable analytics is the most expensive way to get analytics. |
| Very old controllers with limited capacity | Poll selectively and stage the rollout. Don't let a data request destabilise a controller that has been stable for fifteen years. |
| No BMS at all (small sites, packaged rooftop units) | IoT sensor overlay plus meter analytics. Fewer diagnosable faults, but scheduling, runtime and consumption faults are still findable. |
| Poor or absent point naming | This is the real work. Budget for mapping and tagging properly. |
| Missing points (no valve feedback, no per-AHU metering, no CO₂) | Determines which rules can run. A targeted sensor top-up on high-value plant is usually cheaper than universal instrumentation. |
| Building due for major refurbishment or BMS replacement | Deploy FDD first. Fault history is the best available specification for what the new system actually needs to fix. |
Point mapping: the part everyone underestimates
Every FDD deployment stands or falls on whether points are correctly identified. A supply-air temperature sensor mapped to the wrong AHU produces confident, well-presented, entirely wrong diagnostics - and once a team has chased two of those, they stop trusting the platform.
Three things reduce this risk:
- Ask how mapping is done, and who does it. Automated point discovery accelerates the work; it does not replace engineering review. A vendor whose answer is entirely automated is describing an aspiration.
- Ask about semantic tagging. A platform using a standard schema is easier to extend, easier to audit and materially easier to move away from later.
- Allow verification time in the plan. The first four to six weeks of any deployment should be treated as tuning, with false positives expected and eliminated rather than tolerated.
Security and IT approval
Usually the longest pole in the schedule, and the one most often started too late.
- Read-only by default. Diagnostics require no write access. Where supervisory write-back is offered - for building optimisation rather than diagnosis - it should be a separate, explicitly authorised decision with its own approvals.
- Outbound-only connections. No inbound access to the OT network.
- Network segregation. The gateway sits on an OT VLAN with a defined firewall rule to a specific endpoint.
- Vendor security posture. Ask for SOC 2 or ISO 27001 evidence, penetration test summaries, data residency, and alignment with IEC 62443 on the OT side.
- Engage IT and any OT security function in week one. In large organisations this approval takes longer than the technical integration.
How long it takes
For a typical commercial building with an accessible BMS: two to eight weeks from data access to a meaningful first fault list. The variables, in order of impact, are BMS accessibility, quality of existing point naming, IT approval time, and the availability of someone on site who knows what the plant actually does.
Portfolio rollouts move faster per building after the first two or three, because rules, tagging conventions and integration patterns carry across.
Which buildings is FDD suited to?
FDD is not universally worthwhile, and vendors who claim otherwise are not being straight with you. Fit is driven by six factors.
What determines fit
- Energy spend. 8% of a large number funds a programme; 8% of a small one doesn't. Total annual energy cost is the first screen.
- Plant complexity. Central plant with AHUs, chillers, boilers, pumps and terminal units generates many diagnosable fault modes. Simple packaged units generate few.
- Data availability. A BMS with several hundred accessible points makes FDD straightforward. No BMS makes it a sensor project.
- Portfolio scale. Per-building costs fall sharply across a portfolio, and cross-building benchmarking adds a benefit a single site can't access.
- Operational criticality. Where comfort, air quality or continuity carry real consequences, the value of early fault detection exceeds its energy value.
- Someone to act. The most important factor and the least technical. FDD in a building with no in-house engineer and no responsive contractor produces a list nobody works.
By asset class
| Building type | Fit | Why |
|---|---|---|
| Commercial office | Very strong | The category FDD was built for: central plant, BMS coverage, ratings exposure, tenant comfort obligations, multi-building portfolios |
| Shopping centres and retail | Very strong | Long operating hours, heavy HVAC load, many tenancies, scheduling faults common and expensive |
| Airports and transport | Very strong | Vast plant, 24/7 operation, high consequence of failure, sophisticated existing BMS |
| Universities and campuses | Very strong | Many buildings, mixed vintages, central plant, in-house engineering teams, strong sustainability mandates |
| Healthcare | Strong, with care | High criticality and tight environmental requirements make detection valuable; change control is strict and clinical constraints govern any intervention |
| Hotels | Strong | Continuous operation, guest comfort directly tied to revenue, variable occupancy that hides scheduling faults |
| Cultural and civic | Strong | Narrow temperature and humidity bands for collections make sensor drift and control instability consequential |
| Data centres | Specialised | High value per fault, but requires cooling-specific rule libraries rather than a general commercial HVAC library |
| Industrial and warehouse | Variable | Depends entirely on conditioned area and process load; low-intensity warehousing is often a poor fit |
| Multi-residential and BTR | Emerging | Common-area plant and central hot water are diagnosable; in-apartment systems usually are not |
| Small single-tenant buildings | Weak | Packaged units, few points, low spend. Meter-level analytics is generally the appropriate tool |
Rules of thumb
FDD is usually straightforward to justify where a building has a BMS with several hundred accessible points, central plant, and annual energy spend where a single-digit percentage saving is material to the operating budget. Below that, the analysis is genuinely case by case.
At portfolio level the arithmetic changes. Marginal buildings become worthwhile when they ride on a platform already deployed across better candidates, and portfolio benchmarking is often what identifies which buildings deserve capital attention.
Where FDD is the wrong answer today
Being clear about this protects the programmes that should proceed:
- Buildings scheduled for demolition or deep refurbishment inside 12–18 months
- Sites with no BMS, minimal plant and low energy intensity
- Organisations with no capacity - internal or contracted - to act on findings
- Situations where the actual problem is a known, unfunded capital issue; analytics will simply document it monthly
For a portfolio rollout, the usual sequence is: the highest-consumption assets first, then the buildings with the most tenant complaints, then those with ratings or compliance exposure. Deploying everywhere at once, before rules are tuned, generates noise at scale - and noise at scale is how programmes lose their sponsor.
Who uses FDD, and how: user groups and workflows
An FDD platform serves several distinct audiences, and each needs a different view of the same data. Programmes that treat FDD as one screen for one job tend to be used by one person until that person leaves.
The user groups
| User | What they need from FDD | How often |
|---|---|---|
| Facilities or building manager | Today's high-priority faults, tenant complaint context, what's been assigned and to whom | Daily |
| Operations or technical services manager (portfolio) | Ranked backlog across sites, resolution rates, contractor performance, escalations | Weekly |
| In-house engineer or BMS technician | Diagnostic detail: trends, related points, probable cause, what to check first | Daily, task-driven |
| Mechanical and BMS contractors | A clear scope of work with evidence, and a way to report back what was found and done | Per job |
| Energy or sustainability manager | Savings verification, consumption trends, ratings impact, reporting data | Monthly |
| Asset or portfolio manager | Cross-building performance, capital implications, ratings and compliance position | Quarterly |
| Engineering consultancies and service partners | Multi-client visibility, RCx and MBCx delivery evidence, reporting to their own clients | Continuous |
| ESG, finance and executive | Verified outcomes, cost avoided, progress against targets | Quarterly to annually |
| IT and OT security | Data flows, access model, vendor security posture | At onboarding, then periodic review |
The workflows that make it work
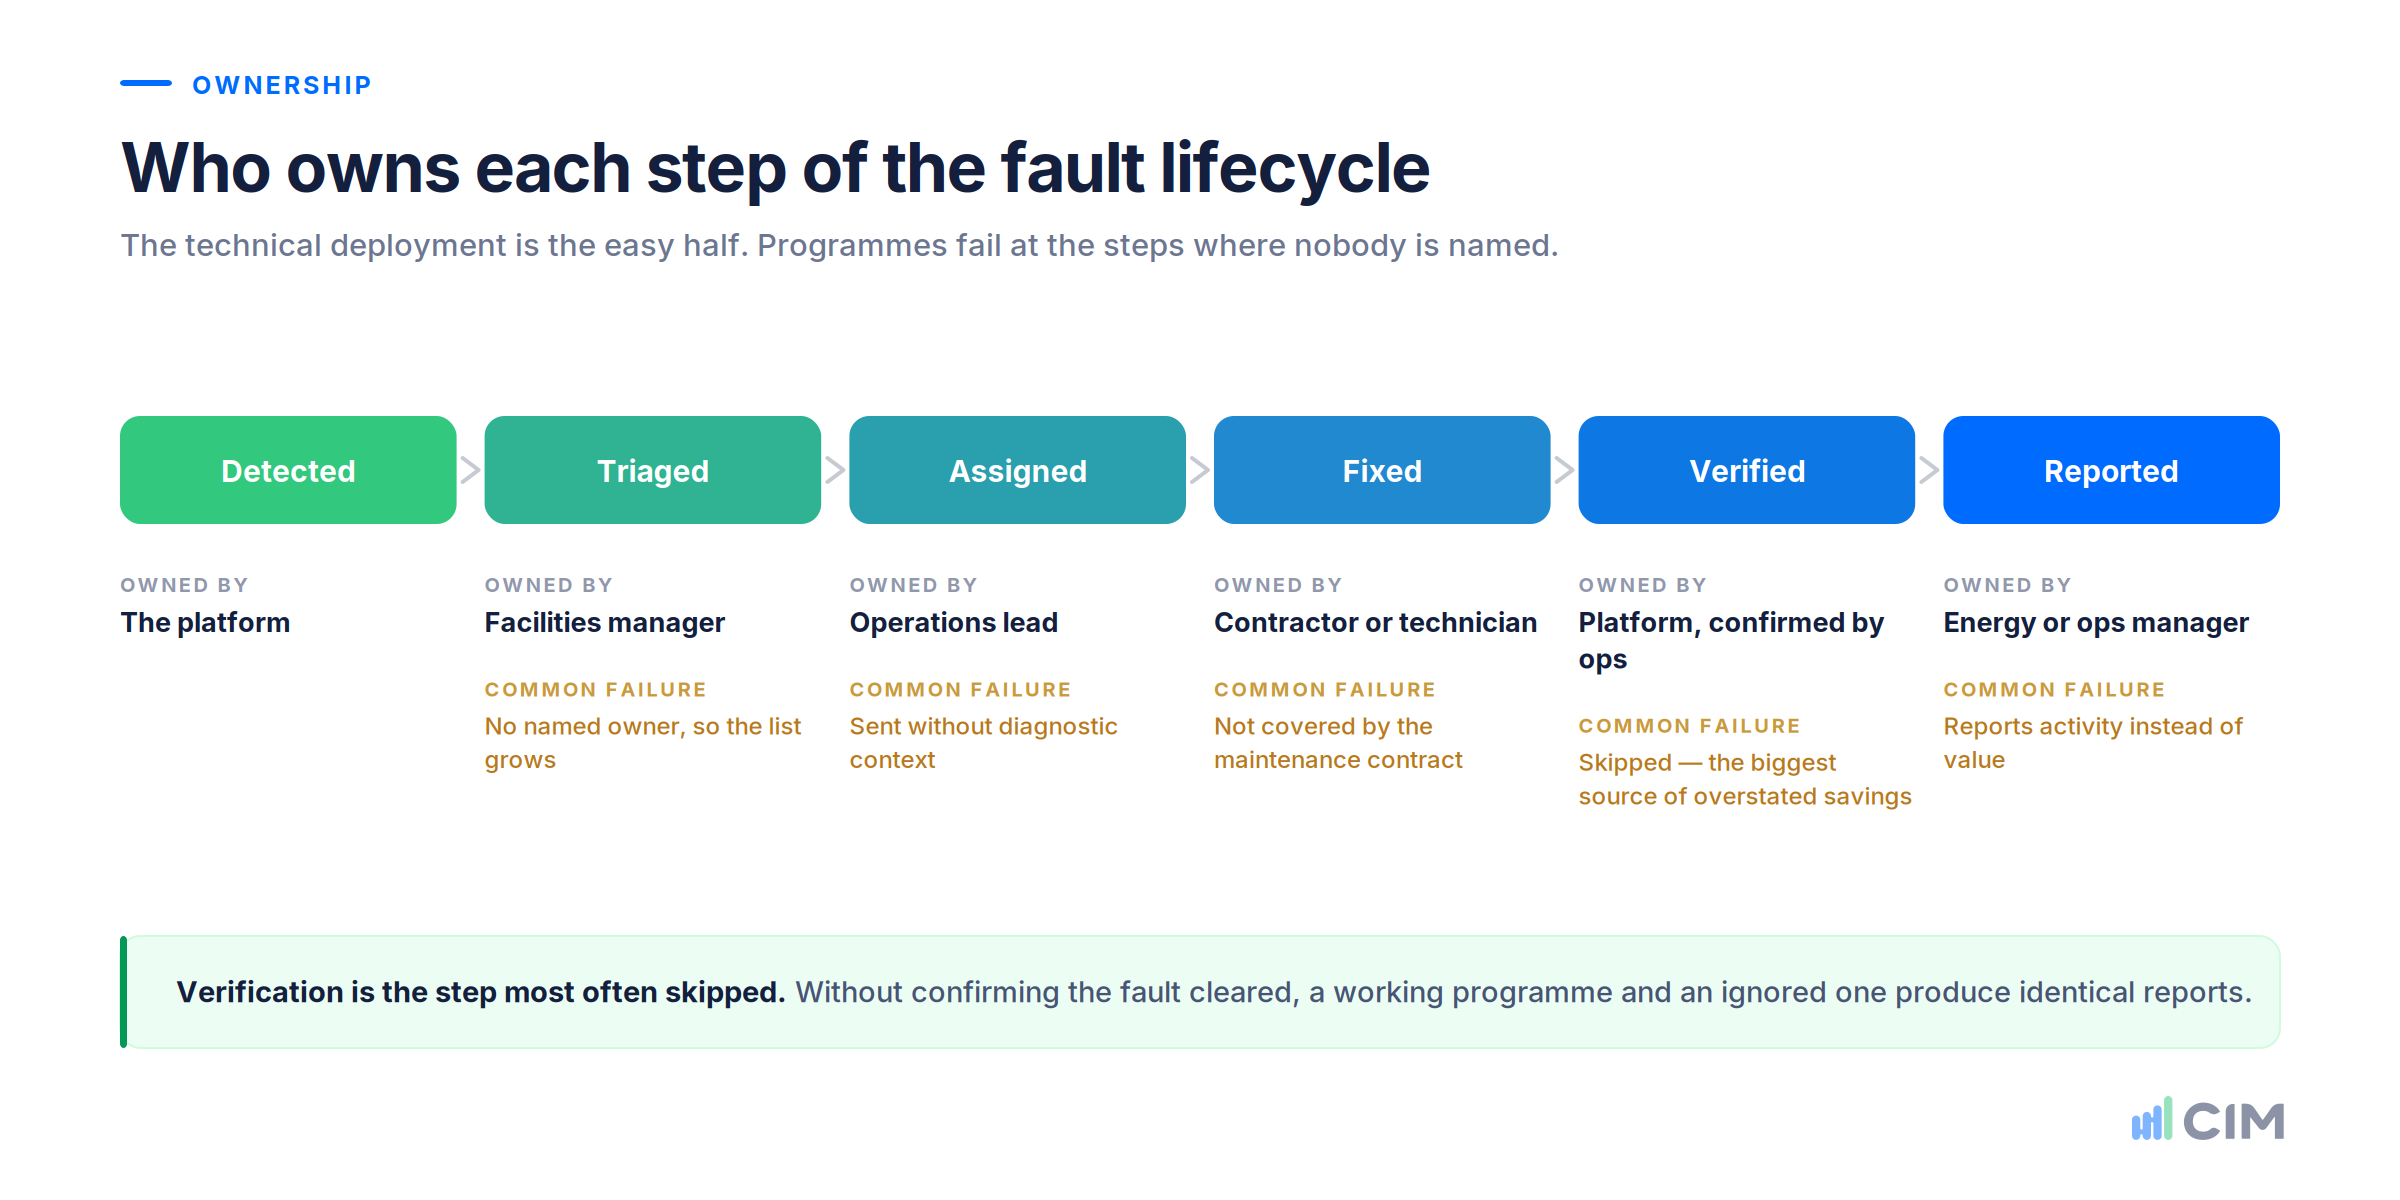
The technical deployment is the easy half. These four routines are what convert a fault list into results.
Daily - triage (10–20 minutes). Someone reviews new high-priority faults, dismisses known conditions, assigns the rest. The goal is a decision on every new item, not a resolution. Without a named owner and a fixed time, this is the routine that quietly stops happening.
Weekly - fault review (30–45 minutes). Operations, engineering and, where relevant, the contractor work the ranked backlog: what's open, what's blocked, what's been fixed and verified, what needs escalating. This meeting is the single strongest predictor of whether an FDD programme delivers.
Monthly - performance reporting. Faults resolved and their estimated value; open backlog and its estimated cost; verification rate; contractor response against SLA; energy performance against baseline. Reported in money and outcomes, not counts.
Quarterly - tuning and review. Rule tuning against false positives, scope expansion to new plant or new sites, contract and KPI review, and a check on whether the priorities the platform ranks still match the priorities the business holds.
Who does what
| Activity | Typically owned by | Common failure |
|---|---|---|
| Triage new faults | Facilities manager or operations lead | No named owner; the list grows |
| Diagnose and investigate | In-house engineer or contractor | Fault sent without diagnostic context |
| Execute the fix | Contractor or in-house technician | Not contracted to respond to analytics-generated work |
| Verify the fault cleared | Platform, confirmed by operations | Skipped - the largest source of overstated savings |
| Report outcomes | Energy manager or operations manager | Reports activity rather than value |
| Tune rules and scope | Vendor engineer with the site team | Left entirely to the vendor, or entirely to the client |
Getting contractors inside the loop
The most common structural failure is a maintenance contract written before FDD existed. If the contract specifies scheduled inspections and reactive callouts, an analytics-generated fault sits outside its scope, and the contractor is not being unreasonable in declining it.
Fixing this is a contract change, not a technology change: analytics-driven tasks named in scope, response times for prioritised faults, and reporting obligations that include what was found and whether the fault cleared. It is also the doorway into data-driven maintenance.
Where FDD is required, not just recommended
FDD is increasingly written into codes and standards rather than left to good practice.
California's Title 24 energy code requires fault detection and diagnostics on economisers for certain packaged air conditioning units, with specified fault conditions the system must detect and report. ASHRAE Guideline 36, which defines high-performance sequences of operation for HVAC systems, incorporates alarming and fault reporting directly into its standard sequences - so buildings implementing Guideline 36 are implementing a form of FDD by default. Green building rating systems including LEED offer credits for ongoing commissioning and monitoring approaches that FDD supports.
Beyond explicit mandates, a larger body of regulation makes FDD the practical means of compliance rather than the compliance itself. Building performance standards in US cities set operational energy or emissions limits that buildings must meet year after year. The recast EU Energy Performance of Buildings Directive pushes member states towards minimum energy performance standards and automation requirements for larger non-residential buildings. UK MEES tightens EPC thresholds for commercial landlords. Australia's NABERS ratings are calculated from measured consumption. None of these name FDD - all of them are far easier to satisfy with it than without it.
The direction of travel is consistent: continuous performance verification is moving from differentiator to expectation.
Where FDD is heading: seven trends
FDD as a technology is mature. What is changing is what happens either side of the diagnosis.
1. From detection to action. The bottleneck has shifted. Finding faults is largely solved; reviewing, triaging and chasing them is not, and it is where most of the human effort now sits. AI agents that review new faults, filter known conditions, draft the work scope and follow up on whether the fix landed are the most consequential development in the category - because they attack the step where programmes actually fail.
2. Purpose-built models rather than general-purpose ones. Early enthusiasm for applying large general models to building data has cooled. Building time-series data is a specific problem: high volume, high noise, strongly seasonal, and unforgiving of confident errors. Smaller models trained specifically on building operational data are proving more accurate, cheaper to run and easier to govern than general-purpose alternatives.
3. Explainability as a procurement requirement. An engineer will not act on “the model says this is anomalous”. They will act on “the heating valve is 40% open while the cooling valve is 60% open, and has been for 11 days”. Buyers are increasingly requiring that a platform show its working - which is pushing the market back towards transparent, rules-grounded logic with machine learning layered over it rather than substituting for it.
4. Semantic interoperability finally landing. Project Haystack, Brick Schema and the emerging ASHRAE Standard 223P are converging on a common way to describe building data. The practical effects: faster onboarding, less bespoke mapping per site, and - significantly for buyers - lower switching costs. Ask any vendor how they handle semantic modelling; the answer is a good proxy for how modern the platform is.
5. FDD becoming native to control sequences. ASHRAE Guideline 36 builds fault reporting into standard sequences of operation. As adoption spreads, new and retrofitted buildings arrive with fault reporting already specified - which raises the floor and shifts the value of a dedicated FDD platform towards cross-vendor coverage, diagnosis quality and workflow rather than detection alone.
6. Regulation converting FDD from optional to expected. Building performance standards, the recast EPBD, MEES and operational ratings all require sustained measured performance rather than a design-stage certificate. Sustained measured performance is not achievable through periodic commissioning. This is the strongest medium-term driver of adoption.
7. Grid interaction and demand flexibility. As buildings are asked to shift load, participate in demand response and respond to carbon-intensity signals, the precondition is plant that does what it is told. A building with stuck dampers, leaking valves and drifted sensors cannot reliably deliver a load-shift commitment. Fault-free operation is becoming the entry requirement for grid-interactive value, not a separate agenda.
A related shift is worth noting: open standards for connecting AI assistants to operational systems mean portfolio questions - which sites are worst on overnight runtime, what changed at this asset last month - are increasingly answerable in plain language rather than through a dashboard. The interface to building analytics is beginning to look less like a screen and more like a conversation.
Deploying FDD: a practical sequence
1. Establish data access. Confirm what your BMS exposes, over what protocol, and at what frequency. This is usually the gating item, particularly across mixed-vendor portfolios. Start the IT and security conversation at the same time, not after.
2. Map and tag the points. Invest here. A rushed point-mapping exercise produces false positives for years, and false positives are how FDD programmes lose credibility.
3. Start with a defined scope. One or two representative buildings, with the fault library tuned to the plant actually installed. Portfolio-wide rollouts before rules are tuned generate noise at scale.
4. Decide who owns the output - before go-live. The most common cause of failure is not technical. Faults arrive, nobody owns triage, the list grows, people stop looking. Name the owner, agree the review cadence, and agree what gets escalated to a contractor.
5. Check the maintenance contract covers analytics-driven work. If resolving a fault requires a contractor who isn't contracted to respond to them, the diagnosis was wasted. This is usually a variation, not a renegotiation - but it needs doing before the backlog builds.
6. Close the loop and verify. Track resolution and confirm the fault cleared. This produces the evidence base for continued investment.
7. Report on outcomes, not activity. “1,400 faults detected” means nothing. “Resolved faults worth an estimated $180,000 annually, 62% of them without a site visit” means everything.
Common pitfalls
Treating it as a dashboard. FDD that nobody is accountable for acting on is a reporting tool, and an expensive one.
Tuning for sensitivity over relevance. A system that flags everything is functionally identical to a system that flags nothing.
Ignoring the fix workflow. If resolving a fault requires a contractor who isn't contracted to respond to them, the fault will persist however well it was diagnosed.
Underestimating point mapping. The most common cause of a credibility collapse in month three.
Skipping verification. Without confirming faults clear, you cannot distinguish a working programme from an ignored one.
Assuming high-performing buildings are exempt. The 6-star building example above is the point: a strong rating reflects performance against a benchmark, not the absence of faults.
Buying software without engineering. Software finds faults. Faults get closed by people who understand plant. Vendors selling only the first half are selling half a programme.
How to evaluate an FDD platform
Useful questions when comparing options.
Coverage and integration
- Does it integrate with our existing BMS vendors and protocols, across the whole portfolio?
- What does connection require on site - gateway hardware, licences, network changes?
- How is point mapping performed, and by whom?
- Does it use a standard semantic schema, and can we export our data model?
Analysis quality
- Is the fault library configurable to our plant, or fixed?
- Does it diagnose probable cause, or only detect symptoms?
- Can it explain, in engineering terms, why a fault was raised?
- How does it prioritise - by energy cost, comfort, asset risk?
Workflow and outcomes
- Can it verify that a fault has cleared after work is done?
- Does it integrate with our CMMS and existing workflows?
- What reporting exists for contractors, executives and ratings submissions?
- How is value calculated, and can that method be audited?
Commercial and support
- What does the vendor's engineering support model look like - software only, or software plus engineers who tune it?
- How is pricing structured - per point, per building, per square metre - and how does it scale?
- What happens to our data model and history if we leave?
That last group separates a data feed from a programme. Software alone finds faults; the combination of software and engineering discipline is what closes them.
Frequently asked questions
Is FDD the same as AFDD?
In practice, yes. AFDD - automated fault detection and diagnostics - emphasises that the analysis runs continuously without an analyst. Most vendors use the terms interchangeably.
Does FDD replace my BMS?
No. FDD reads data from the BMS and analyses it. The BMS continues to run the building. The two do different jobs and neither substitutes for the other.
Can't I just get analytics from my BMS vendor?
Sometimes, and on a single-vendor site it may be sufficient. Test three things: whether it works across the other vendors in your portfolio, whether it diagnoses probable cause or only visualises trends, and whether the fault library can be configured to your plant.
How much does FDD cost?
Pricing is usually per monitoring point or per building. The LBNL benchmark puts median software implementation around US$8 per point, US$2.70 per point annually for software and roughly US$8 per point annually in labour, on a typical 1,300-point deployment. Those 2020 figures are indicative; the useful comparison is against a single-digit percentage of the building's energy spend.
How long before it delivers value?
Two to eight weeks to a first meaningful fault list on a typical building. Quick-win savings usually land in months one to three. Verified savings at benchmark levels typically take six to twelve months of sustained resolution.
Does FDD control my building?
Diagnostic FDD is read-only. Some platforms offer supervisory write-back for optimisation, but that is a separate capability requiring separate authorisation. If a vendor is vague on this, get it in writing.
Do I need to install new sensors?
Usually not to begin with. Most value comes from data your BMS already collects. Targeted additions - valve position feedback, sub-metering on major plant, CO₂ where indoor air quality matters - extend what can be diagnosed and are best decided after the first round of findings.
My BMS is twenty years old. Is FDD still possible?
Almost always. Serial networks are bridged with a router, closed systems are reached through a gateway or vendor interface, and equipment outside the BMS can be covered with sensors. Age affects effort, not feasibility - and an old BMS is usually carrying more faults, not fewer.
How many faults will it find?
More than expected. Given that around 40% of air handling units carry a fault on any given day, a first run on an unmonitored building typically produces a backlog measured in dozens to hundreds. This is why prioritisation, not detection, is the capability that matters.
Who should own the faults?
A named individual with time in their week, supported by a fixed review cadence. This decision predicts programme success better than any technical choice.
Does FDD work across multiple BMS vendors?
A good platform does, and that cross-vendor view is one of the main reasons to buy an independent platform rather than a vendor-native module. Confirm it against your actual vendor list, not a capability statement.
Is FDD worth it for a single building?
It can be, where the building has central plant, an accessible BMS and material energy spend. Below that threshold, meter-level analytics is often the more proportionate tool.
Where FDD fits in a building analytics strategy
FDD is usually the first capability a building analytics platform delivers, because the payback is fastest and the evidence is concrete. It rarely stays the only one. Once fault data flows reliably, the same infrastructure supports energy analytics, ratings tracking, maintenance optimisation, indoor environment monitoring and portfolio benchmarking - which is why FDD tends to arrive as part of a broader building analytics deployment rather than as a standalone tool.
CIM's PEAK Platform takes this approach: it supplements an existing BMS with continuous fault detection and diagnostics, drawing on BMS, meter, IoT, weather and occupancy data to identify faults, rank them by impact, and track them through to resolution - so building teams spend their time fixing problems rather than hunting for them.
The bottom line
Faults are not the exception in commercial buildings; they are the steady state. With 40% of air handling units carrying a fault on any given day, the question for most operators isn't whether their buildings have faults - it's whether anyone knows about them.
FDD makes that knowable, and the economics are unusually clear: a median 8% energy saving against a modest per-point operating cost, plus maintenance, asset life and comfort benefits that are harder to price but easy to feel.
The technology is mature. What separates the portfolios that get results from those that don't is rarely the algorithm - it's whether someone owns the list, works it, and checks the fault actually cleared.
Put fault detection to work on your buildings
PEAK finds the faults, ranks them by impact, and verifies the fix - across any BMS, with no new hardware.
Watch a PEAK demoExplore FDD in PEAK
.avif)
Unlock the power of building analytics. Discover how data-driven insights can optimize building performance, reduce costs, and improve sustainability.
PEAK uncovered hidden fan fault, cutting energy use dramatically.
Read the story →