An HVAC upgrade is sold on a saving. Twelve months later, someone asks for the evidence: the client's finance team, a utility programme, the other party to an energy performance contract, or a landlord deciding whether to fund the next phase. The consulting engineer is the person expected to produce it.
This guide maps the tools engineers in the US and UK use to verify energy savings after an HVAC upgrade, a plant replacement or a retro-commissioning programme: what each kind of tool does, the standards behind it, and where each one stops. For the method itself, including the IPMVP options, baselines and ASHRAE Guideline 14, see our companion guide to measurement and verification of energy savings.
Key takeaways
- No single tool verifies a saving. Verification is four jobs: measure, model, confirm and keep. Most toolsets cover only the first two.
- M&V software calculates the saving. Commercial platforms and free tools such as LBNL's RMV2.0 and OpenDSM build normalised baselines, mostly at whole-facility level (IPMVP Option C).
- A calculation cannot show the upgrade is running as designed. That needs BMS trend data and fault detection at equipment level.
- UK consultants work to CIBSE guidance as well as IPMVP. TM39, revised in 2026, covers metering; TM22 covers in-use assessment; TM63 covers calibrated modelling.
- Savings decay unless someone keeps watching. Schedules drift and overrides get left in place, so a saving verified in year one needs monitoring to survive year two.
What tools do consulting engineers use to verify energy savings after an HVAC upgrade?
Consulting engineers use four kinds of tool: metering and data platforms to measure consumption, M&V software to model the baseline and calculate the saving, BMS trend analysis or fault detection to confirm the upgraded plant runs as designed, and continuous monitoring to keep the saving. Standards such as IPMVP, ASHRAE Guideline 14 and CIBSE TM39 frame each step.
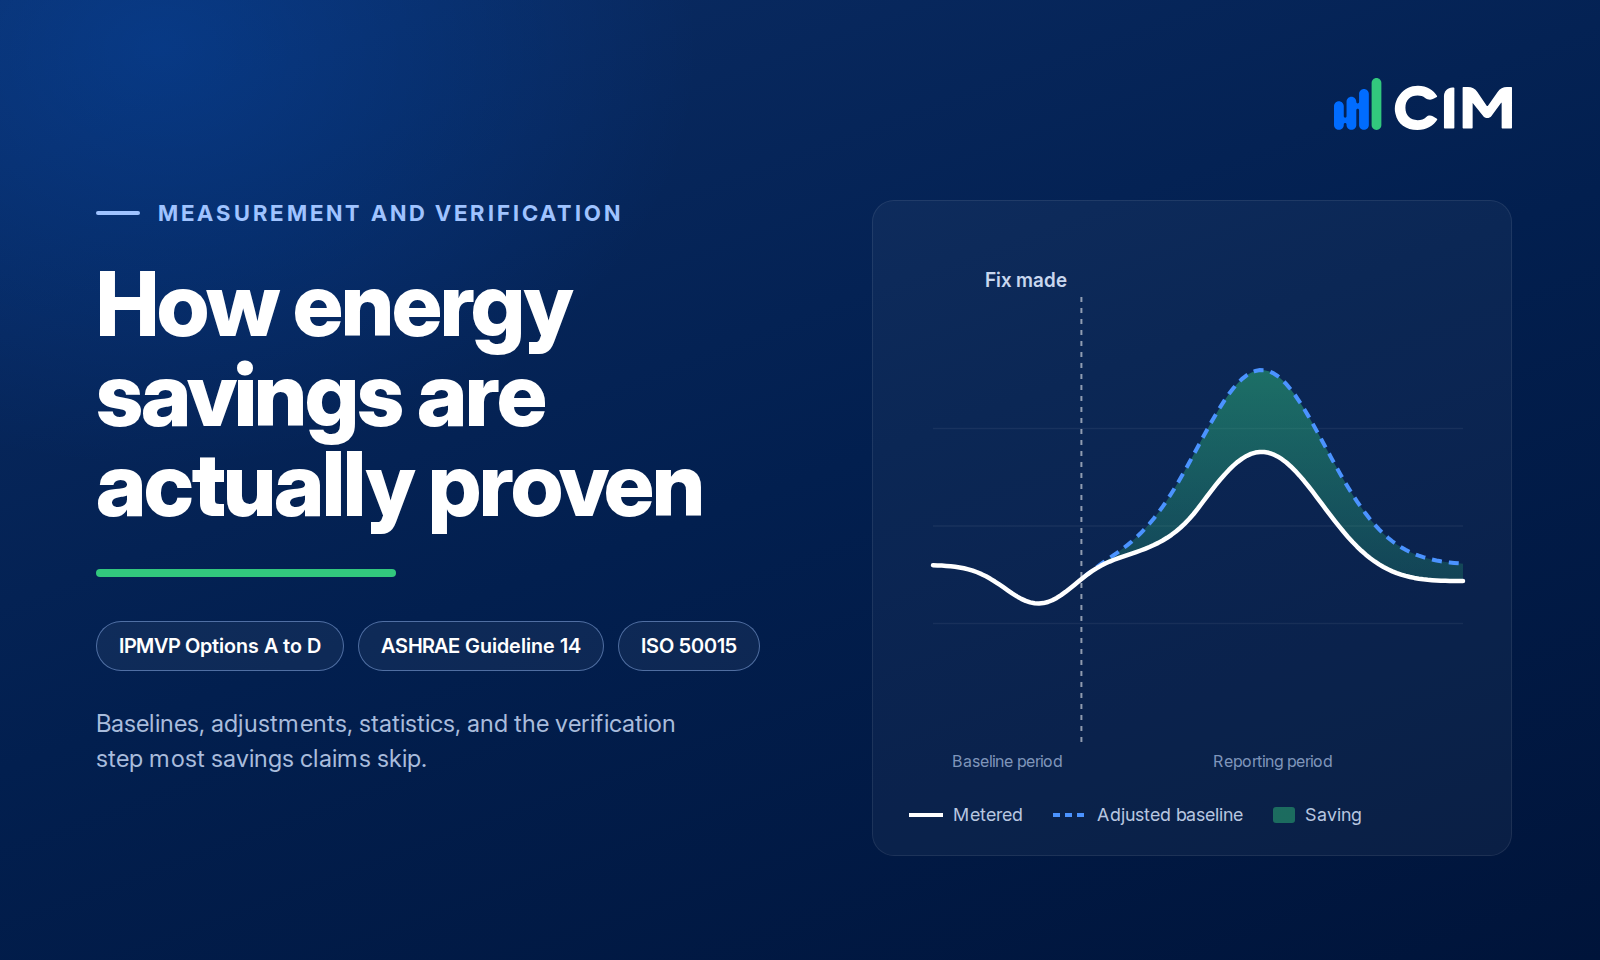
Energy savings verification is the process of showing, with measured data, that an upgrade reduced energy use by a stated amount compared with what the building would otherwise have used. That last phrase is why it takes more than a meter. A saving is the gap between a measured line and a modelled one, and the model is only as good as the data and the operating record behind it.
The tools that search results and AI assistants surface for this question are almost all calculation tools. They are necessary, and they are not sufficient. A whole-building model can show that consumption fell. It cannot show whether the new chiller is staging correctly, whether the variable speed drives are actually modulating, or whether the schedule set at commissioning is still in place six months later. Those answers sit in the building management system (BMS) data, not on the utility bill.
Utility interval data, revenue and sub-meters, energy monitoring platforms, data validation and labelled gap filling.
CIBSE TM39 (2026), FEMP M&V Guidelines 5.0
M&V software with normalised baselines, such as EnergyCAP, Power TakeOff Verify and Ento; free RMV2.0 and OpenDSM; calibrated simulation where there is no baseline.
IPMVP, ASHRAE Guideline 14, CIBSE TM22 and TM63
BMS trend analysis, fault detection and diagnostics on point data, spot and short-term measurements at the system boundary.
IPMVP Options A and B, FEMP M&V 5.0 HVAC measures
Continuous fault detection with fixes confirmed in the data, drift and override alerts to a named owner, persistence reporting the client can see.
IPMVP non-routine adjustments
The rest of this guide takes each job in turn, then covers what changes for UK consultants and how to choose a toolset.
What metering and data do you need before you can verify anything?
You need interval energy data at the boundary you plan to verify, from utility, revenue or sub-meters, plus the independent variables that drive consumption, usually outdoor temperature and occupancy. For a single system you also need trend data on the equipment itself. Gaps, meter changes and estimated readings must be flagged before any model is built.
Most verification disputes start with data, not maths. A sub-meter that was never commissioned will quietly report the wrong circuit for years, and a baseline built on monthly bills struggles to separate a modest saving from ordinary month-to-month variation. Fixing that after the upgrade is too late, because the baseline period has already gone.
In the UK, the reference is CIBSE TM39 Building Metering and Monitoring, revised in May 2026 for the first time since 2009. It sets out good practice for the design, specification, installation, commissioning, data export and use of metering and sub-metering in non-domestic buildings. CIBSE Journal's overview of the update highlights a new section on meter communications, plus guidance on data validation, analytics and visualisation, and thermal, water and steam meters.
In the US, FEMP's M&V Guidelines Version 5.0, published in September 2024, set out how measurement supports each IPMVP option for federal performance-based contracts, and include guidance on HVAC measures. Utility programmes generally rely on interval data from the utility meter for whole-building verification.
The BMS is the other data source, and the one most often overlooked. Trend logs carry the operating state that meters cannot: run hours, valve positions, fan and pump speeds, supply temperatures and setpoints. The catch is that point names vary between installers and sites, so the data needs normalising before it can be analysed consistently. Our guide to BMS point naming, Haystack and Brick covers that step. Whatever tool you use, it should label any estimated or filled values, so an M&V report never treats an estimate as a measurement.
Which M&V software calculates the saving?
M&V software builds a baseline model from pre-upgrade data, adjusts it for weather and other routine variables, and reports avoided energy use against it. Commercial options include EnergyCAP, Power TakeOff's Verify and Ento; free options include LBNL's RMV2.0 and the open-source OpenDSM library. Most of these tools work at whole-facility level, IPMVP Option C.
The US Federal Energy Management Program puts it plainly in its guide to energy management information system capabilities: "IPMVP Option C: Whole Facility is the approach most commonly provided by EMIS vendors." That matters when choosing a tool, because Option C works best when the expected saving is large relative to the building's total consumption.
The tools engineers most often meet, described from each one's own documentation:
- EnergyCAP. Its IPMVP measurement and verification feature lets users create M&V projects under IPMVP Option B or Option C, defining the measures, baseline and reporting periods and routine adjustments.
- Power TakeOff Verify. The company's advanced M&V page describes a platform aimed at utilities and energy service companies, running regression-based models, with drift detection alerts and non-routine event logging.
- Ento. Its savings verification product builds a weather- and calendar-normalised baseline for each meter and reports savings with confidence intervals. Its FAQ says it follows IPMVP, primarily Option C.
- RMV2.0 (free). Lawrence Berkeley National Laboratory's open-source R package for advanced M&V runs on your own hardware, builds baseline models from smart meter data, estimates savings and flags possible non-routine events.
- OpenDSM (free). Formerly OpenEEmeter, OpenDSM is an open-source Python library hosted by LF Energy that implements the CalTRACK methods, with daily, billing-period and hourly models.
Whichever tool you choose, ask to see the model, the independent variables it uses, its fit statistics against ASHRAE Guideline 14 criteria and the date range it was trained on. A savings figure without those is a claim, not a verification. Our M&V guide explains the Guideline 14 thresholds and how advanced M&V models are tested. If you deliver verification inside a utility programme, the programme may specify the approach and tools it accepts: our guide to MBCx software and tools covers programme requirements.
How do you verify the savings from a single plant or system upgrade?
Isolate it. Under IPMVP Options A and B you measure the upgraded system inside its own boundary, using spot or continuous measurements of the parameters that drive its energy use: run hours, motor speed, flow, temperatures and power. BMS trend data usually supplies most of these, which makes the building's own controls the cheapest verification instrument on site.
Whole-building verification struggles when the upgrade is small relative to total consumption, or when other changes land in the same period, such as a new tenant, a second project or a change in occupancy. The Efficiency Valuation Organization has published work on detecting savings under 10% with Option C, which shows how much care that takes. For a chiller replacement, a fan upgrade or a pump drive retrofit, measuring at the system boundary is usually more direct.
A practical workflow for a single system looks like this:
- Trend the key points before the work. Capture at least a representative operating season of run hours, speeds, flows and temperatures from the BMS, plus outdoor temperature.
- Confirm the points are right. Check sensor calibration and mapping on site. A misread valve position or a drifting temperature sensor will distort both the baseline and the result.
- Plot against weather, not time. Comparing the system's energy or run hours against outdoor temperature, restricted to occupied hours, separates the effect of the upgrade from the effect of a mild month.
- Check the operating state after the work. Confirm the plant is doing what it was designed to do: staging, modulating, resetting and switching off when it should.
- Record anything non-routine. Note overrides, failures and occupancy changes as they happen, with dates.
Step four is the one most toolsets skip, and it is where verification most often fails in practice. In CIM's sample, about 1 in 6 closed fault tickets were closed before the data confirmed the fix. Our guide to verifying that a contractor actually fixed an HVAC fault covers how to check.
Two partner examples show the pattern. Hoffman Building Technologies deployed PEAK on its own 180,000 sq ft headquarters in Charlotte first and reduced fan power on one air handling unit by 58%. At Joliet Central High School in Illinois, Aero Performance Group checked BAS runtime trends against historical ComEd meter data, which confirmed that every HVAC system had been running 24/7 for years and gave the project a measured baseline. Once the units were back on schedules, facility electricity use fell 35.5%, verified in under five months.
How do UK building services consultants verify energy savings after plant upgrades?
UK consultants typically pair IPMVP with CIBSE guidance: TM39 for metering and monitoring, TM22 for assessing in-use energy from metered data, and TM63 for calibrated modelling. Data platforms such as IES iSCAN bring BMS, utility and sensor data together, and independent specialists such as EEVS and TEAM Energy deliver IPMVP-based M&V as a service.
The CIBSE documents each cover a different part of the job:
- CIBSE TM22 sets out a method for assessing the energy performance of an occupied building from its metered energy use, and includes a software implementation of the method.
- CIBSE TM63, published in 2020, gives a methodological framework for measurement and verification of building energy performance in use, using calibrated modelling, with a worked office example.
- CIBSE TM39, covered above, sets the standard for the metering that both depend on.
On the tools side, IES iSCAN centralises time-series data from building and energy management systems, utility portals, IoT sensors and historic files alongside simulated data from other IES tools, and IES lists M&V among its uses. The UK Green Building Council lists iSCAN in its solutions library as an in-use building data analysis tool, and separately compares five energy monitoring platforms for commercial buildings using information supplied by the providers. UKGBC notes that it does not endorse individual solutions.
Where independent verification is needed, specialist firms provide it as a service. EEVS publishes a free M&V guide setting out the IPMVP options and a step-by-step process, and TEAM Energy offers an M&V service designed in accordance with IPMVP and delivered by certified M&V professionals. Organisations running an ISO 50001 energy management system may also reference ISO 50015; our M&V guide compares it with IPMVP and Guideline 14.
The operating evidence matters as much in the UK as anywhere. CSR Sustain, a UK partner that runs its own PEAK-based service, works from the same equipment-level evidence. At Exchange Quay in Manchester, electricity use fell 10.8% year on year in the first quarter of 2026.
Why do verified savings disappear, and which tools keep them?
Savings disappear because buildings drift: schedules get changed, overrides are left in place after a callout, sensors fail and setpoints creep. A saving verified in year one is a snapshot. Keeping it needs continuous monitoring at equipment level, with alerts that reach a named owner and a fix that is confirmed in the data.
None of these changes trips a BMS alarm. Comfort is usually fine, nothing is broken, and the first sign is the next utility bill or the next annual M&V report, by which time months of the saving have gone. The research on how quickly retro-commissioning savings decay is summarised in our M&V guide. In CIM's own data, about 1 in 25 action tickets concern an override left in place after a visit.
Two examples from PEAK sites show what catching drift early looks like:
- Overrides after a fire test. At one site, several systems were left on manual override after an annual fire test. PEAK flagged it and the contractor corrected it within a day, avoiding an estimated 8% increase in energy use over the quarter it would likely have run. Read the story.
- Rules that keep running after close-out. A London headquarters cut electricity use by 14% in 11 weeks, measured on its own meters against the same weeks a year earlier. PEAK kept running the same rules after each action closed, so a schedule that crept back would be flagged again rather than quietly undoing the saving.
Meter-level tools can tell you that consumption has moved away from the model; some M&V platforms now offer drift alerts for exactly that. What they cannot tell you is which equipment moved and why. That is the job of fault detection and diagnostics (FDD) running continuously on BMS data, with each finding assigned to someone and closed only when the data confirms it.
How should an engineering firm choose a savings verification toolset?
Choose by job, not by brand. Check that the toolset can take meter and BMS data together, show its baseline model and fit statistics, log non-routine events, confirm the upgraded plant's operating state and keep watching after handover. Most firms end up combining an M&V calculation tool with equipment-level monitoring rather than relying on one product.
Use the checklist below against the tools you already have. The gaps it shows are usually in the third and fourth jobs, not the calculation.
Two practical points sit behind the checklist. First, agree the verification approach with the client at the proposal stage, not after the work, because the baseline period cannot be recreated later. Second, separate the evidence that the upgrade works from the calculation of what it saved, and report both. Clients and programme reviewers increasingly ask for each.
Where does CIM's PEAK Platform fit?
PEAK is not an M&V calculation engine and does not replace an M&V plan. It covers the confirm and keep jobs: it reads the existing BMS, runs engineering fault rules on equipment data, confirms fixes in the data and keeps watching after handover, so the saving your M&V tool calculates rests on plant that is actually running as designed.
- Confirm. PEAK's fault detection and diagnostics runs 5,000+ engineering rules across mixed BMS estates. Each finding becomes an action with a named owner, and the rule confirms when the condition has cleared.
- Data. PEAK connects read-only to the existing BMS with no new hardware, and buildings are typically live within about 30 days. Meter gap filling marks every estimated value, and weather comparison charts plot equipment data against outside temperature with occupied-hours filters.
- Keep. Rules keep running after an action closes, and overrides and out-of-hours operation surface as they happen, which gives an Option C calculation the non-routine event record it depends on.
- Honest estimates. PEAK's automated cost savings estimate the financial impact of energy faults so teams can prioritise them, with the formula shown. They are estimates for triage, not verified savings, and should be reported that way.
Engineering partners use this to add evidence to the savings they report. Aero Performance Group, a Chicago RCx and MBCx provider, verifies around 6 million kWh of energy-saving incentives a year for its clients. Our guide to how engineering firms run RCx, MBCx and data-driven maintenance on FDD covers the delivery model, and The Building Performance Engineer's FDD Playbook sets out the closed loop from detection to verified rectification.
Give your savings figures equipment-level evidence
See how engineering partners use PEAK to confirm upgrades are running as designed and keep the savings they verify.
Watch a partner demoTalk to our partner teamFrequently asked questions
What tools help consulting engineers verify energy savings after HVAC upgrades or capital works?
Most engineers combine four kinds of tool: interval metering and data platforms, M&V software that builds a weather-normalised baseline (commercial tools such as EnergyCAP, Power TakeOff's Verify or Ento, or free tools such as LBNL's RMV2.0 and OpenDSM), BMS trend analysis or fault detection to confirm the plant runs as designed, and continuous monitoring to keep the saving after handover.
What tools help UK building services consultants verify energy savings after plant upgrades?
UK consultants usually work to IPMVP alongside CIBSE guidance: TM39 for metering and monitoring, TM22 for in-use energy assessment and TM63 for calibrated modelling. Data platforms such as IES iSCAN combine BMS, utility and sensor data, independent specialists such as EEVS and TEAM Energy provide IPMVP-based M&V, and fault detection on BMS data confirms the upgraded plant is operating as intended.
Is there free software for verifying energy savings?
Yes. Lawrence Berkeley National Laboratory publishes RMV2.0, an open-source R package for advanced M&V that builds baseline models and estimates savings on your own hardware. OpenDSM, formerly OpenEEmeter, is an open-source Python library hosted by LF Energy that implements the CalTRACK methods. Both handle the calculation; neither confirms that the upgraded equipment is operating as designed.
Can BMS trend data be used to verify energy savings?
Yes, especially for a single system. Under IPMVP Options A and B, the parameters that drive a system's energy use, such as run hours, motor speed, flow and temperatures, can come from BMS trends, provided the points are correctly mapped and the sensors are calibrated. BMS data also shows whether the upgrade is operating as designed, which utility meter data cannot.
Which IPMVP option should I use after an HVAC upgrade?
Use Option A or B when the upgrade is a discrete system whose energy use you can isolate and measure, such as a chiller, fan or pump. Use Option C when the expected saving is large relative to the whole building's consumption. Use Option D when there is no usable baseline, for example after a major refurbishment, and calibrated simulation is needed.
Why do energy savings decline after an HVAC upgrade?
Because operation drifts. Schedules are changed for a reason that later lapses, equipment is left in hand or on override after a callout, sensors drift and setpoints creep. None of this raises a BMS alarm, so it goes unnoticed until the next utility bill or M&V report. Continuous equipment-level monitoring catches it as it happens.
Does fault detection software replace M&V software?
No. M&V software calculates the saving against an adjusted baseline; fault detection confirms that the equipment behind the saving is operating correctly and keeps watching after handover. They answer different questions. Engineering firms that need verified savings for a client, contract or utility programme typically use both, with FDD supplying the operating evidence and the non-routine event record the calculation relies on.

A practical playbook for the engineers who deliver building performance. Learn how to run retro-commissioning, monitoring-based commissioning and data-driven maintenance on an FDD platform: compress the RCx cycle from 12-18 months to 3-5, close the loop from alert to verified fix, and turn fixed-term projects into recurring revenue. Written for RCx and MBCx firms, engineering consultancies, and BMS and mechanical contractors.
Every HVAC unit at a 550,000 sq ft high school had run around the clock for years. Aero Performance Group used PEAK to find it, put 21 units back on schedules and verified a 35.5% electricity cut in under five months, at no cost to the district.
Read the story →