Ask what software runs monitoring-based commissioning and you will usually get a vendor list. That misses the point. MBCx is a process, not a product: trend data has to be collected and named, faults found, savings measured against a baseline, fixes tracked to completion and evidence assembled for a utility programme. No single tool category does all of that, and the gaps between them are where MBCx programmes lose money.
This guide is for engineering firms, commissioning providers and owners' energy teams putting together an MBCx toolset, particularly in US utility programme markets. It maps the seven layers of the MBCx stack to the tools that cover them, summarises what Lawrence Berkeley National Laboratory found about which tools deliver savings, sets out the free public tools and where they stop, explains what utility programmes ask of software and providers, and ends with a scorecard for choosing a platform.
Key takeaways
- MBCx needs a stack, not a single tool. Data access, a data model, meter analytics, fault detection, M&V, action tracking and programme reporting all have to be covered.
- FDD drives the savings. In LBNL's Smart Energy Analytics Campaign, FDD users saw median savings of 9%, against 3% for energy information systems.
- Free tools are strong on M&V and weak on live monitoring, workflow and scale.
- Programmes qualify providers and evidence, not logos. Utilities typically approve the engineering firm and ask for persistent, verifiable savings.
- For firms delivering MBCx at scale, the deciding factors are onboarding time, ready-made rules, verified fixes and reporting across many clients.
What tools does monitoring-based commissioning need?
Monitoring-based commissioning needs tools for seven layers: data access and trending, a consistent data model, meter analytics, fault detection and diagnostics, measurement and verification, action tracking with verified fixes, and programme reporting. Free tools, programmable toolkits, energy information systems and turnkey FDD platforms each cover some layers well and others not at all.
Scroll sideways to see all tool types.
| MBCx layer | Free public tools | Programmable toolkit | Energy information system | Turnkey FDD platform |
|---|---|---|---|---|
1 Data access and trendingBAS trend logs, interval meters, gateways | ||||
2 Data model and taggingPoint naming, Haystack or Brick | ||||
3 Meter analyticsEnergy use, baselines, anomalies | ||||
4 Fault detection and diagnosticsRules across systems and equipment | ||||
5 Measurement and verificationSavings against a baseline | ||||
6 Action tracking and verified fixesOwner, status, fix confirmed in data | ||||
7 Programme reportingEvidence packs for incentives |
Typical coverage for each category, not for any single product. Check each vendor against the layers you need.
Two layers decide whether an MBCx programme scales. The data model (layer 2) determines whether rules written once can run on every building, which is why point naming and tagging matter so much; our guide to BMS point naming, Haystack and Brick explains the problem. Action tracking (layer 6) determines whether findings become savings. A list of faults that nobody owns, or that closes without the data confirming the fix, is where most MBCx value is lost.
Programme reporting is partial in every category because each programme asks for its own evidence pack. The best a tool can do is hold the baseline, the measure history and the verified results in one place, so the pack takes hours rather than weeks.
EIS or FDD: which tools actually deliver MBCx savings?
Fault detection and diagnostics delivers more. In the Smart Energy Analytics Campaign, run by Lawrence Berkeley National Laboratory with 104 organisations and 6,500 buildings, FDD users achieved median energy savings of 9% after two years, against 3% for energy information systems. FDD costs more and needs more engineering time, and both paid back in about one to two years.
| Median values | EIS | FDD |
|---|---|---|
| Annual energy savings | 3% | 9% |
| Annual cost savings per sq ft | $0.03 | $0.24 |
| Software and installation, per sq ft | $0.01 | $0.06 |
| Recurring software, per sq ft a year | $0.01 | $0.02 |
| In-house effort, per building a month | ~1 hour | ~9 hours |
The difference follows from what each tool sees. An energy information system works at the meter: it shows that a building used more energy than expected, but rarely why. FDD works at the equipment and point level, so it can say which air handling unit is heating and cooling at the same time, which valve is leaking, or which schedule has crept. That is the information an MBCx engineer needs to scope a measure and verify it.
The labour figure matters as much as the savings. Nine hours per building per month is the in-house effort LBNL participants reported for FDD, and for an engineering firm running dozens of client buildings it is the number that decides margin. Platforms that triage, assign and follow up automatically reduce it; how they do that is covered in how FDD platforms help engineers triage, follow up and verify faults.
Which free MBCx tools are available, and where do they stop?
The main free tools are ECAM, the Universal Translator, RMV2.0, OpenEEmeter and NMECR for analysis and M&V, ENERGY STAR Portfolio Manager for benchmarking, and PNNL's Building Re-tuning method. They are strong for savings calculations and one-off analysis, but none provides live monitoring, workflow or verified fixes across a portfolio.
Free M&V tools have earned their place. The US Department of Energy's guidance on advanced M&V lists ECAM, RMV2.0, OpenEEmeter, the Universal Translator and NMECR as example free tools for meter-based savings (DOE and NEEP), and they are a sensible way to check the savings a commercial platform reports. Our guide to measurement and verification explains the IPMVP options they support.
Where they stop is continuity. MBCx is defined by monitoring that never ends, and every free tool here works on data someone has exported. The moment a firm runs MBCx for more than a handful of buildings, the cost of exporting, cleaning and re-running analysis by hand outweighs the licence it saved.
Which commercial MBCx and FDD platforms are there?
Commercial MBCx software falls into four groups: programmable analytics toolkits such as SkySpark, turnkey FDD platforms such as CIM's PEAK, Clockworks Analytics and CopperTree Kaizen, energy information systems built around meters, and analytics suites from controls manufacturers. They differ most in who builds the rules, how long onboarding takes and whether they track fixes.
A programmable toolkit gives an experienced team complete control, at the cost of building the data model and rules itself; SkyFoundry's SkySpark is the best-known example and is widely used by commissioning firms with in-house developers. Turnkey FDD platforms ship with a rule library and handle onboarding, so the team starts from findings rather than code. Some vendors also support customers through specific utility programmes, as Cimetrics does with its Analytika platform (Cimetrics). Energy information systems are strongest at meter analytics and M&V, and manufacturer suites work best on their own controls.
For detailed, sourced profiles of each platform, including who owns it and how it handles poor-quality BMS data, see our comparison of FDD and building analytics platforms.
What do utility MBCx programmes require from your software?
Utility MBCx programmes usually specify evidence rather than products: FDD or monitoring software with defined capabilities, enough baseline and post-installation data to calculate savings, measures that persist in the monitoring system, and an approved service provider to deliver the work. Requirements differ by programme and change each year.






Programme rules change each year. Check the current programme manual before scoping. Logos are trademarks of their owners and are shown for identification only.
The pattern across programmes is consistent: they qualify the provider and judge the evidence. That puts the engineering firm, not the software vendor, at the centre of the programme relationship, and it means the firm's platform has to make two things easy: proving that each measure was implemented, and showing that it is still delivering months later. Persistence requirements like Mass Save's are where spreadsheet-based MBCx struggles most.
Incentives can transform the economics. Aero Performance Group, a Chicago-area RCx and MBCx provider, verifies around 6 million kWh of energy-saving incentives a year for its clients on CIM's PEAK Platform, and grew its active project portfolio by 50% without adding resources. Our complete guide to monitoring-based commissioning lists the US utility programmes that pay for MBCx.
How should engineering firms choose MBCx software?
Engineering firms should choose MBCx software on delivery economics: how quickly a building comes online, whether rules for common MBCx measures come ready to run, whether savings can be submitted to a programme, whether each fix is verified and monitored for drift, and whether the firm can report across many clients under its own name without the vendor competing for the work.
Onboarding time is the first filter. A platform that needs months of manual point mapping per building cannot support a programme pipeline, while automated point classification and a ready-made rule library can bring a building live in weeks. The second filter is what happens after a finding: MBCx savings depend on measures being implemented and staying implemented, so the platform should track every measure to a verified fix and flag drift. ADG Energy, a US partner, often starts a client on recommissioning and moves into ongoing monitoring once the first round of measures is verified, and its value shows in events like the time PEAK flagged a failed chiller while a school's own automation front-end was down, before classrooms lost cooling.
Use the scorecard below when you evaluate a platform. Tick each question it answers well.
For the commercial side of delivering MBCx as a service, from pricing tiers to renewal, see how engineering firms run RCx, MBCx and data-driven maintenance on FDD and how to structure an analytics-backed maintenance contract.
What does MBCx software cost?
LBNL's campaign data gives the best public benchmark: FDD software cost a median of about $0.06 per square foot to install and $0.02 per square foot a year to run, against about $0.01 for each with energy information systems. Licensing is usually per building, per floor area or per data point, and in-house engineering time is often the largest cost.
Licence price is rarely what decides the business case for an engineering firm. The cost that scales with the portfolio is engineering time per building: onboarding, triage, follow-up and reporting. A platform that halves that time can cost more per square foot and still deliver a better margin on every MBCx contract. Utility programmes in several states also fund part of the software set-up, so check what the local programme covers before comparing licence prices. We explain pricing models for monitoring and maintenance contracts in more detail in our guide to analytics-backed maintenance contracts.
Where does CIM's PEAK Platform fit?
CIM's PEAK Platform is a turnkey FDD platform built for engineering partners delivering RCx, MBCx and data-driven maintenance. It reads the existing BMS across all major brands without new hardware, classifies raw points against a single data model, deploys more than 5,000 engineering rules automatically and typically brings a building live within about 30 days. Every fault is assigned, followed up and closed only when the data confirms the fix held, which is the evidence MBCx programmes ask for. CIM is partner-first: its partners hold the programme relationships and the client work, and CIM licenses PEAK to them per data point. More than 20 engineering partners use PEAK across more than 700 commercial buildings. See also Cx vs RCx vs MBCx compared and the webinar on how FDD improves RCx and MBCx outcomes.
Deliver MBCx at portfolio scale
See how engineering partners use PEAK to onboard buildings in weeks, verify every measure and evidence savings for utility programmes.
Talk to our partner teamWatch a partner demoFrequently asked questions
What software is used for monitoring-based commissioning?
MBCx uses a stack rather than one product: trend data collection from the BAS and meters, a consistent data model, fault detection and diagnostics, meter analytics and M&V, and action tracking. Turnkey FDD platforms cover most layers; free tools such as ECAM, RMV2.0 and OpenEEmeter are commonly used for M&V.
What is the best MBCx software?
The best MBCx software is the one that covers the layers your programme needs with the least engineering time per building. For firms delivering MBCx across many clients, that usually means a turnkey FDD platform with automated onboarding, ready-made rules, recognised M&V methods and fixes verified in the data.
Is there free software for monitoring-based commissioning?
Yes. ECAM, the Universal Translator, RMV2.0, OpenEEmeter and NMECR are free tools for analysis and M&V, ENERGY STAR Portfolio Manager is free for benchmarking, and PNNL publishes a free Building Re-tuning method. They work on exported data, so they do not provide continuous monitoring or workflow.
What is the difference between EIS and FDD for MBCx?
An energy information system analyses meter data and shows when a building uses more energy than expected. FDD analyses equipment and point data and shows which system is at fault. In LBNL's Smart Energy Analytics Campaign, FDD users achieved median savings of 9% against 3% for EIS.
Do utility MBCx programmes require specific software?
Most programmes specify capabilities and evidence rather than a product. Seattle City Light requires FDD software meeting set functionality, Mass Save expects measures to persist in the monitoring system, and ComEd and NYSERDA work through approved or prequalified providers. Check the current programme manual before scoping.
How much does MBCx software cost?
LBNL's Smart Energy Analytics Campaign reported median FDD costs of about $0.06 per square foot to install and $0.02 per square foot a year, and about $0.01 each for energy information systems. In-house engineering time is often the larger cost, so onboarding speed and automation matter.
Can you use SkySpark for monitoring-based commissioning?
Yes. SkySpark is a programmable analytics toolkit widely used by commissioning firms with in-house developers. The trade-off is that your team builds and maintains the data model and rules, whereas turnkey FDD platforms ship with a rule library and handle onboarding.
What tools do you need for M&V in an MBCx project?
You need interval energy data, weather data and a baseline model that follows a recognised method such as IPMVP Option B or C or ASHRAE Guideline 14. Free tools such as RMV2.0, OpenEEmeter, ECAM and NMECR can build the model; many MBCx platforms also calculate savings directly.
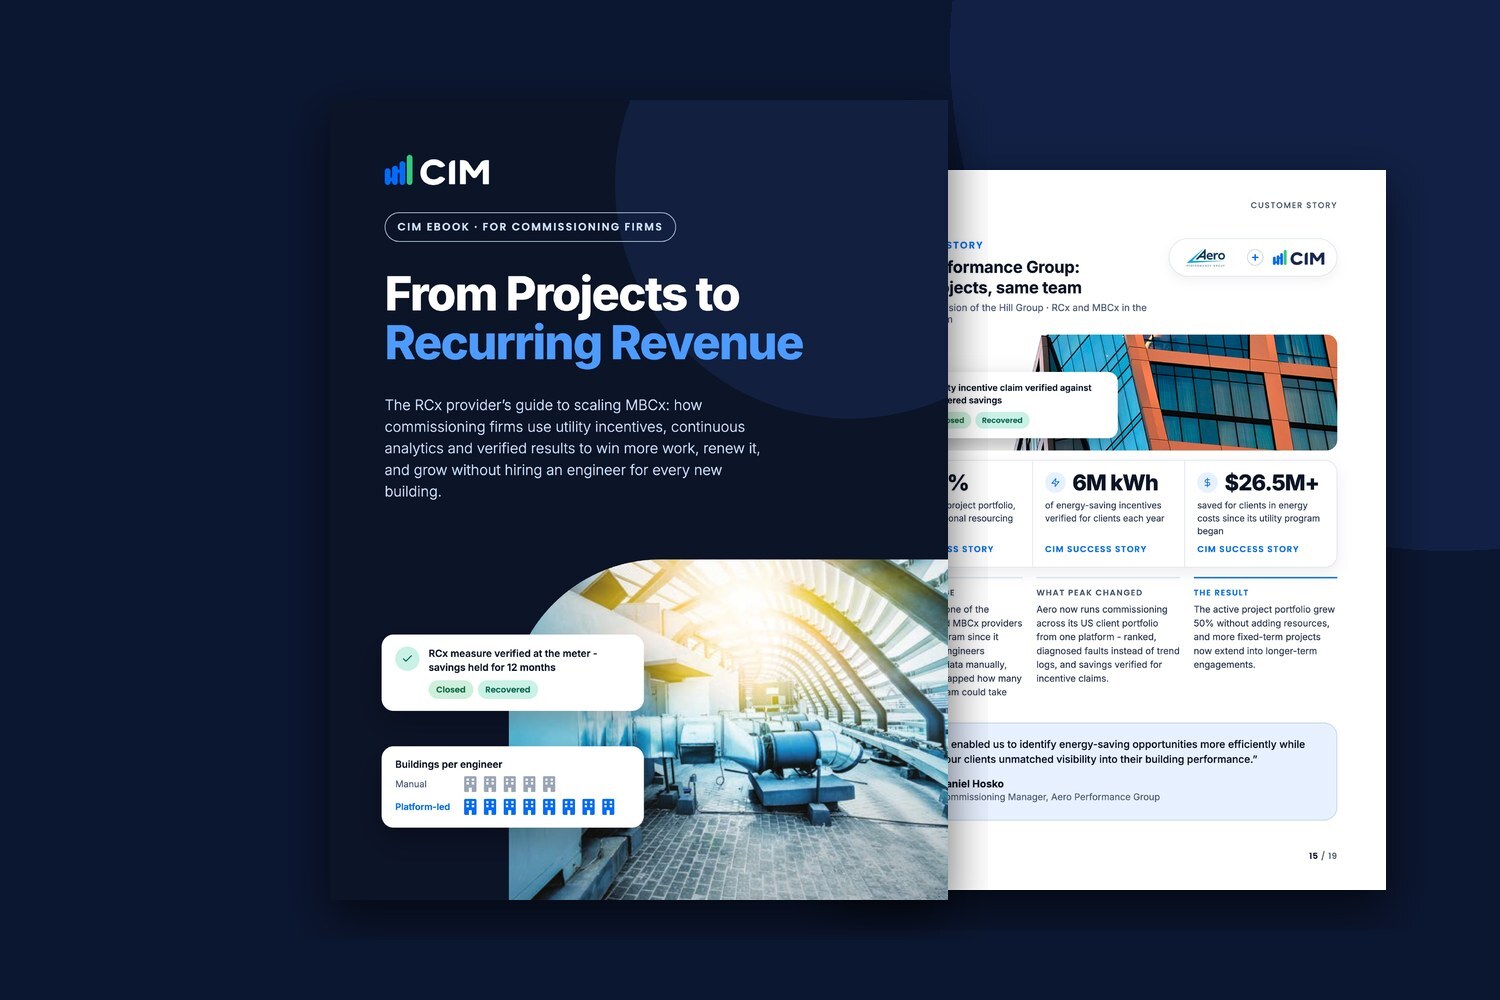
A practical, strategic guide for commissioning firms ready to grow beyond one-off projects. Learn where US utility incentives already pay for RCx and MBCx, what moving from five to eight buildings per engineer is worth, how to sell RCx and MBCx as one engagement and fix the renewal problem, and how to deliver at scale - with a customer story from Aero Performance Group and a 90-day launch plan. Written for principals, directors and commissioning leads at RCx, MBCx, Cx and energy engineering firms.
A new chiller failed at a US high school on the same morning its BAS front-end went dark. PEAK flagged it first thing, and the fix landed before anyone in class noticed.
Read the story →