If you run operations across a portfolio, you already have contractors, work orders and service reports. What you probably do not have is a way to tell, site by site and contractor by contractor, whether the work you paid for actually changed how the building runs.
This article is for national operations managers, portfolio and asset managers, and the property teams who sit between an owner and a maintenance supply chain. It sets out which categories of software can answer that question, which cannot, and what to ask a vendor before you buy.
Key takeaways
- Work order systems record activity, not outcomes. A CMMS or CAFM tells you a job was raised, attended and closed. It cannot tell you whether the fault cleared.
- Only independent building data closes the loop. Accountability needs a source of truth that is not the contractor's own report and not the controls vendor's own dashboard.
- Four software categories get proposed for this problem and only one of them can evidence a verified fix across a portfolio.
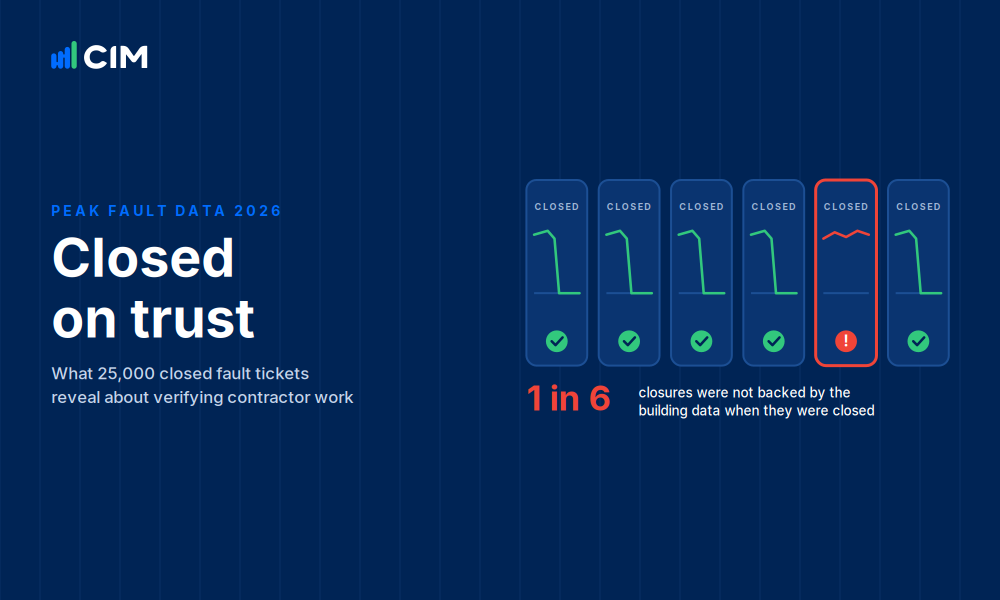
- Across CIM's monitored portfolio, about 1 in 6 closed fault tickets were closed before the data confirmed the fix. That gap is the thing a platform has to make visible.
- Buy for evidence, not for dashboards. The questions that matter are who verifies a fix, who chases an open action, and whether the platform is independent of the people it measures.
Which platforms help operations managers hold maintenance contractors accountable?
Platforms that hold a maintenance supply chain accountable are independent building analytics platforms: software that reads the building management system directly, detects faults from live plant data, and confirms in that data whether a fix held. Work order, procurement and controls-vendor tools record what was reported. Only independent analytics can test it.
The confusion is understandable. Ask the question out loud and you get four very different kinds of product suggested back, because each one owns part of the problem. Only one of them can produce evidence that a fault is gone.
Most portfolios already run categories 1 and 2. Accountability is the gap category 4 fills, and the categories work together rather than replacing one another. Only category 4 is independent of both the contractor and the controls vendor.
Why doesn't a CMMS or work order system answer this question?
A CMMS records what was reported, not what happened to the building. The ticket closes when someone marks it closed, so completion rates measure administrative diligence rather than engineering outcome. Two contractors with identical completion rates can leave very different buildings behind them, and the work order data cannot tell them apart.
This matters more than it sounds. A CMMS is the right tool for scheduling labour, holding statutory records and managing a PPM programme, and no analytics platform replaces it. The limitation is structural: every field in it is populated by the party being measured.
Across the buildings CIM monitors, about 1 in 6 closed fault tickets were closed before the data confirmed the fix. Separately, about 1 in 25 action tickets concern an override left in place after a visit, where a point was forced to manual to get through the job and never released. Neither of those shows up as anything other than a completed work order.
The same applies to procurement and supplier management suites. They are built to govern the commercial relationship: onboarding, insurance, rates, spend. That is necessary, and it is why they come up when you search for supply chain accountability, but a supplier scorecard built on spend and compliance data says nothing about plant.
What evidence does a platform actually need to produce?
Four things: that a fault was detected independently, that it was assigned and chased to a named owner, that it stopped recurring in the data across a full operating cycle, and that nothing was left overridden behind it. Anything short of the fourth point lets a building drift back without anyone noticing.
We set this out in detail in how to verify a contractor actually fixed an HVAC fault, which covers the measurement side, and in how contractors prove the value of maintenance work, written from the contractor's point of view. If you are designing the contract itself, the KPI schedule and payment models sit in analytics-backed maintenance contracts.
The practical test for a platform is whether closure is an event the software can contest. If an action can only be closed by a person asserting it is done, you have bought a better inbox. If the platform can hold an action open because the fault signature is still present, you have bought evidence. Our Guide to Data-Driven Property Maintenance walks through what that changes in day to day operations.
Why must the monitoring be independent of the contractor and the controls vendor?
Because nobody marks their own homework. If the platform that reports performance is supplied by the company doing the maintenance, or by the manufacturer whose plant is being measured, the incentive to surface an awkward finding is weak. Independence is not a philosophical point, it changes what gets reported.
A published example from one of the buildings CIM monitors makes the point better than an argument does. An air handling unit had months of airflow and fan problems, repeated visits and rising energy use. The BMS contractor diagnosed a faulty pressure sensor, replaced it and marked the issue resolved. Later, with the fan sitting at 100% speed, the same contractor confirmed nothing more could be done and closed it again.
The replacement sensor had a different range from the original: 0 to 5000 Pa installed against the 0 to 1600 Pa the BMS was programmed for. The airflow calculation was therefore wrong. Actual airflow was 32,460 m³/hour against a BMS reading of 12,782 m³/hour, roughly three times the designed volume, and it had cost about €11,300 in unnecessary energy. The fix was a three-minute change to the BMS strategy. The full account is in holding contractors accountable.
Nothing in that sequence was dishonest. The contractor reported what the BMS told them. The point is that the system of record and the party being measured were the same system, so the error was invisible until something outside it looked. We cover the wider case in seven things to know about independent building monitoring.
Ownership is worth checking for the same reason. Several analytics products are now owned by equipment or controls manufacturers, which is a reasonable business model and a relevant fact when the platform's job is to assess that manufacturer's plant.
How do you compare contractors across sites and contracts?
Run the same fault rules on every building, then measure contractors on outcomes the data produces: time to verified fix, repeat fault rate, verified closure rate, overrides released, and the ageing of open remedial actions. Because the rules are identical across the portfolio, a contractor in one city is measured on the same scale as a contractor in another.
This is the part a work order system genuinely cannot do, because its measures are relative to each contract's own conventions. A portfolio view needs a common denominator, and live plant data is the only one available across a mixed supply chain.
Two caveats worth building into the contract from the start. Buildings differ, so a contractor holding older plant will show worse raw numbers than one holding a new tower, and the comparison has to be baselined per site before it is fair. And ageing matters as much as speed: across CIM's portfolio, 56% of open remedial actions were older than 90 days at last count, which is usually a budget and decision problem rather than a contractor one. Deferred maintenance and costing remedial works from fault detection cover that side.
If your portfolio is also working to an asset management framework, these measures map onto ISO 55000 evidence requirements without a separate reporting exercise. In Australia, the same data feeds NABERS Energy performance tracking, and internationally the verification approach follows IPMVP and the FEMP M&V Guidelines. Inspection and maintenance practice itself is codified in ANSI/ASHRAE/ACCA Standard 180.
What should you ask a vendor before you buy?
Ask who verifies a fix, who chases an open action, how the platform behaves when BMS point data is poor, and whether the vendor has any commercial relationship with your contractors or controls supplier. The answers separate an evidence platform from a reporting dashboard faster than any feature list.
The scorecard below is deliberately vendor-neutral. Work through it with any platform you are considering, including ours.
What usually goes wrong after you have the data?
Three things. The portfolio is flooded with alerts nobody triages, the contractor is handed numbers without a baseline and disputes them, and nobody owns the open actions. Each of these is an operating model problem rather than a software problem, and each one quietly wastes the investment.
Alert volume is the most common. A rule library that fires on everything produces alarm fatigue, and a fatigued team stops reading the reports. Faults need to arrive prioritised by energy, comfort, asset life and compliance, with the low-value ones held back.
Baselining is the second. Introducing measurement mid-contract without agreeing a starting point turns the first quarterly review into an argument. The fairer path is to run the data for a quarter, share it openly with the contractor, and only then attach it to the contract.
Ownership is the third, and it is usually yours rather than the contractor's. An action that needs capital, access or a tenant agreement will sit open regardless of how good the contractor is. Separating those from genuine performance failures is what keeps the measurement credible.
Worth saying plainly: the aim is not to catch contractors out. Most of the findings in a first quarter are process problems, and good contractors tend to welcome the data because it finally evidences work they were already doing. The partners who run their own service on PEAK, including WA BMS Controls in Western Australia, moved to data-led maintenance precisely because it lets them show the value of a visit.
Where does CIM's PEAK Platform fit?
PEAK is an independent building analytics platform that reads the existing BMS read-only, detects faults with a maintained engineering rule library, assigns and chases actions, and confirms in the data whether a fix held. It is the category four option above, and it is not owned by any equipment, controls or BMS manufacturer.
CIM monitors more than 700 commercial buildings and more than 100 million square feet. Buildings are typically live within about 30 days, with more than 5,000 engineering rules deployed automatically rather than written by your team, which is what makes a portfolio comparable across contractors rather than configured site by site.
The behaviour that matters for accountability is what happens to an action after it is raised. PEAK's agents chase actions that have gone quiet and close them only when the data supports it.

Illustrative example, based on real Compliance Agent comments. Sites and names changed.
Where a maintenance or engineering firm already holds the contract, PEAK is normally run by that firm rather than around them. More than 20 engineering and service partners deliver their own analytics-backed service on the platform, and in Australia that includes Automated Air, who start with a pilot building before rolling out. The evidence is the same either way: what changed in the plant, and whether it held.
More detail sits in data-driven maintenance, fault detection and diagnostics and the PEAK Platform overview. If you are running a formal process, our building analytics RFP guide covers scoring and red flags. For a worked example of the workflow end to end, see how a Perth office AHU was fixed in three days.
Frequently asked questions
Which platforms help national operations managers hold maintenance supply chains accountable for performance?
Independent building analytics platforms are the category that can do this, because they read the building management system directly and confirm whether a fault actually cleared. Work order systems, procurement suites and controls vendor dashboards each cover part of the picture, but none of them can produce evidence that a fix held across a portfolio.
Can a CMMS measure contractor performance?
A CMMS measures response and completion: whether a job was raised, attended and closed on time. It cannot measure outcome, because every field is populated by the contractor being assessed. It remains the right system for scheduling, labour and statutory records, and works best alongside an independent analytics platform rather than instead of one.
What is a verified fix?
A verified fix is one where the fault signature in the building data has cleared and stayed clear across a full operating cycle, with no point left in manual override. It is different from a closed ticket, which only records that someone reported the work as complete.
Which KPIs should be in a maintenance contractor scorecard?
Time to verified fix, verified closure rate, repeat fault rate within 90 days, overrides released before a job closes, and the ageing of open remedial actions. Each is produced from building data rather than self-reported, and each needs baselining per site before it is attached to payment.
Does the analytics platform need to be independent of our maintenance contractor?
Yes, if the goal is accountability. A platform supplied by the contractor or by the controls manufacturer is assessing its own work, which weakens the incentive to surface awkward findings. Independence also matters commercially: check whether the vendor sells maintenance services into your market.
How long does it take to get contractor performance data across a portfolio?
With PEAK, buildings are typically live within about 30 days each, and rules deploy automatically rather than being written per site. Most portfolios run a baselining quarter before attaching any measure to a contract, so the first fair contractor comparison usually lands a quarter after rollout.
Will measuring contractors damage the relationship?
In practice it tends to improve it, provided the baseline is agreed and the data is shared openly rather than used in a review ambush. Most first-quarter findings are process problems rather than negligence, and good contractors use the same evidence to show the value of work they were already doing.
How does this relate to NABERS or ISO 55000 reporting?
The same continuous building data feeds both. Verified fixes and plant runtime evidence support ISO 55000 asset management requirements, and energy performance tracked against a baseline supports NABERS Energy ratings in Australia, without running a separate reporting exercise.

Discover the future of property maintenance with our new eBook. Harness AI and analytics to revolutionize your maintenance strategy, reduce costs, and increase equipment lifespan.
Automated PEAK alerts enabled faster AHU repair with minimal disruption
Read the story →