
PEAK Enterprise · For owners who operate
Know what's broken. Know who's on it. Know it's holding.
CIM is the Full Loop Building Operations System. PEAK Enterprise doesn't just find faults across your portfolio — it diagnoses the cause, assigns the fix to whoever holds it, and checks the building's own data to prove it held.
Your buildings, your team, your contractors. One operating system underneath all of it.

PEAK · portfolio
Tuesday 07:40
What’s broken
3 priority 1
Chiller 2, Skyline Tower — approach temperature drifting 4.2 °C
Root cause diagnosed · same pattern at 3 sites
Who's on it
Named owner
Assigned to mechanical contractor — on site Thursday
Engineering-grade fix attached · tracked
Is it holding
Verified
AHU-3 override cleared — consumption back to baseline
Closed 11 days ago · still holding
Ask it
"What needs attention across the portfolio this morning?" — answered from live data in Claude, ChatGPT or Copilot.
100M+ ft²
Of commercial property under continuous monitoring
Owner-operators, REITs and the partners who service them
80%
Verified action completion across PEAK portfolios (P1 and P2 alerts)
Faults closed and confirmed against building data
17.4M kWh
Verified energy savings, one portfolio
Charter Hall · 60+ buildings · 15M sq ft
Trusted by leading global portfolios






What PEAK Enterprise is for
Built for the three things an owner is accountable for.

Know what's broken
Transparency
One live view of what is broken, who holds it and whether the fix held - across every building, team and contractor.

Know who's on it
Supply chain management
Every action is owned, closed out and verified in the building's data, so contractor performance is comparable across sites.

Govern on evidence
Governance strategy
Years of verified outcomes give the board and investment committee capital plans, ESG disclosure and forecasts where every number traces back to a real operational event.
The owners who lead, run PEAK
Five of the ten most sustainable funds on earth belong to a CIM customer.
Charter Hall — a long-term CIM customer with PEAK deployed across its office portfolio — topped the 2025 GRESB rankings, taking 2nd, 3rd, 4th, 5th and 9th place in the Standing Investments Benchmark from a field of 2,382 funds covering 500,000 buildings across 76 markets.
Source: Charter Hall, 15 October 2025 ·

GRESB 2025 · global top 10
2,382 funds
Charter Hall (CH)
1
2
CH
3
CH
4
CH
5
CH
6
7
8
9
CH
10
Charter Hall Office funds · Standing Investments Benchmark
Why operations teams run on PEAK
Three things PEAK does for the people accountable for performance.
Each one is a full solution in its own right. The links go straight to the detail.
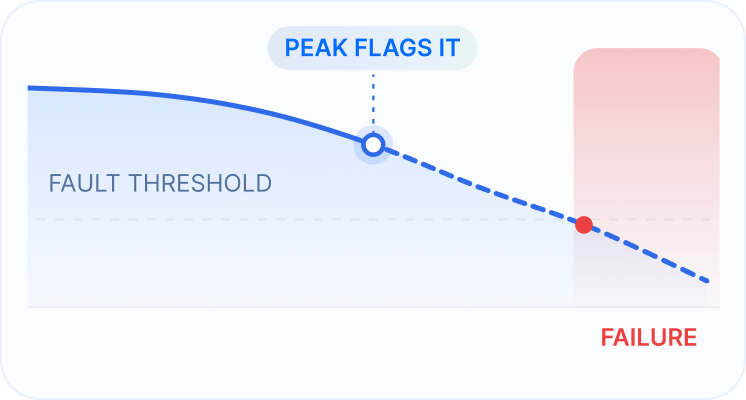
EQUIPMENT HEALTH · CONTINUOUS
Predictive maintenance, not scheduled checks
Every asset is scored continuously against how it should be running, so degradation shows up as a trend long before it shows up as a failure. Every alert lands with a priority, a named owner and a recommended action.
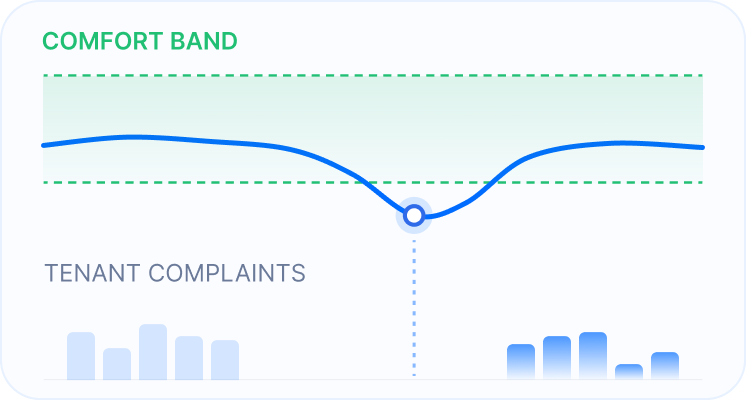
INDOOR ENVIRONMENT · ZONE BY ZONE
Downtime caught before tenants notice
Comfort drift is a fault long before it's a complaint. PEAK sees it in the data, diagnoses the cause and puts it in the queue — so the issue is closing while the help desk is still quiet.
Go deeper
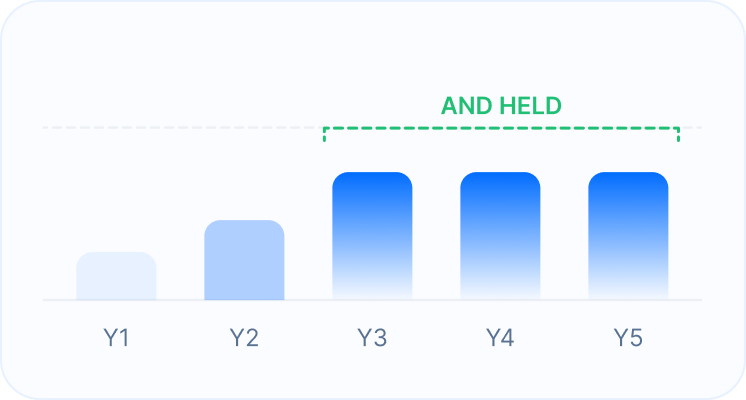
NABERS · LEED · BREEAM · GRESB
Ratings that hold, year on year
A rating is easy to lift once and hard to keep. Every number PEAK reports traces back to a verified operational event, so the improvement survives the next cycle and the next audit.
The full loop
Six stages. You only staff two of them.
Every analytics platform runs the first three and hands you a list. The loop only closes if somebody owns the last three — so here is exactly who holds each stage once PEAK is running. Select a stage.
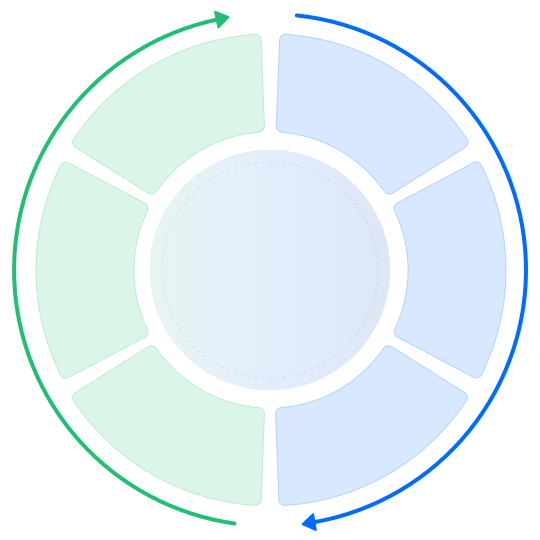






The full loop
Select a stage
Intelligence
Acquire
01
BMS, meters, IoT and equipment data unified over standard protocols — BACnet, Modbus, Niagara. No rip-and-replace, no proprietary hardware, no six-month point-tagging project.
PEAK
Runs it
Connects, standardises and QAs every point against one ontology
Your team
Approves
Signs off network access. Nothing else.
Your contractor
Not involved
No role at this stage
What the owner gets
A portfolio dataset you own — one that survives every contractor change.
Intelligence
Assess
02
Every asset scored continuously against how it should be running, so degradation shows up as a trend long before it shows up as a failure — or as a capex request.
PEAK
Runs it
Scores equipment health across all plant, continuously
Your team
Reviews
Sets thresholds and reads the portfolio ranking
Your contractor
Not involved
No role at this stage
What the owner gets
Replacement decisions made on condition evidence rather than age.
Intelligence
Alert
03
Not a flag — a diagnosis. What is wrong, why, what it is costing, and the engineering-grade fix, from a library of advanced FDD rules refined across every portfolio CIM operates.
PEAK
Runs it
Diagnoses root cause, prices the impact, prioritises
Your team
Reviews
Sees a ranked list, not an alarm feed
Your contractor
Not involved
No role at this stage
What the owner gets
Your engineers stop hunting for problems and start fixing them.
Execution
Action
04
The action goes to whoever actually holds it — in-house engineer, FM, or mechanical contractor — with priority, recommended remedy and expected outcome attached. Nothing waits for a human to triage it.
PEAK
Routes it
Assigns, schedules and tracks every action
Your team
Decides
Human authority is architectural, not a setting
Your contractor
Delivers
Arrives with a triaged list, works to tracked workflows
What the owner gets
Your contractor stops deciding what to look at on site.
Execution
Accountability
05
This is the stage owners buy. PEAK returns to the building’s own data to confirm the fault signature actually disappeared — not that a ticket was closed — then benchmarks who closes work fast and well, across every site and every contractor.
PEAK
Verifies
Checks the fix against building data, benchmarks every party
Your team
Holds it
Takes the comparison into the vendor review
Your contractor
Is measured
On outcomes, not attendance
What the owner gets
The difference between “closed” and “fixed” stops being a matter of trust.
Execution
Augment
06
Years of verified outcomes become capital plans, ESG disclosure and forecasts where every number traces back to a real operational event.
PEAK
Forecasts
Models from verified history, not from assumptions
Your team
Uses it
Takes a defensible case to the investment committee
Your contractor
Not involved
No role at this stage
What the owner gets
A capex deferral you can actually defend to an IC.
01–03 Intelligence
finding what matters
04–06 Execution
done, verified, improved.
The platform
PEAK Enterprise
One platform, from raw telemetry to boardroom reporting.
Anyone's AI can find a fault. The hard part is the scan that never stops, and the governance that makes sure the fix landed.

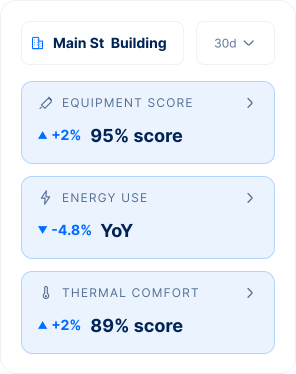
Real-time data and no-code AFDD
IoT collection, mapping and tagging, 6,000+ FDD rules, equipment monitoring, utility and IEQ monitoring, enterprise-grade API. Your team writes no code and maps no points.
Digital workflow and dashboards
Closed-loop action management, client dashboards and reports, advanced visualisation across every asset — so the same record serves the site engineer and the board pack.
Equipment Health — a live MRI for your buildings
A full health scan of every building, every 15 minutes. Up to 70% of manual predictive checks automated, 10× deeper and 100× more frequent than a roster can deliver. This is the number that makes the maintenance conversation different.
AI governance stack, with Hannah
Execution
The AI expert system recommends the right action — and Hannah, the governance and QA agent, checks the quality of every single one. She chases open actions, escalates what is drifting past its close date, and verifies the fix against the building's data. Hannah recommends and chases. Your engineers decide.
The shift
The way buildings used to be run, and the way they run now.
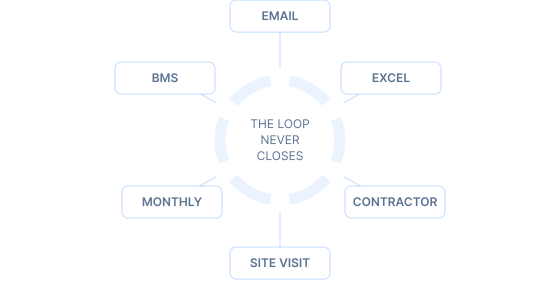
The way buildings used to be run

Performance lived in monthly meetings, Excel trackers, email threads and ad-hoc reports.
Issues surfaced late — usually once somebody complained.
Sites, vendors and teams didn't talk to each other.
When an FM or BMS contractor left, the building's institutional knowledge went with them.
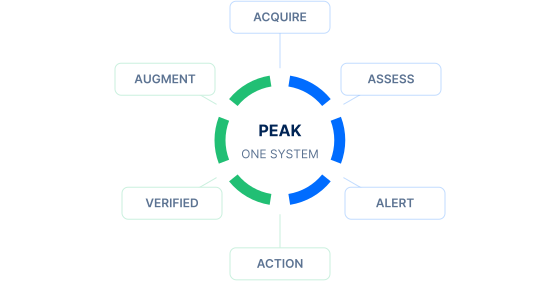
The way they run now

Performance lives in one continuous operating system.
Every fault has a priority, an owner and a verified close-out.
Equipment health is visible in real time, and contractor performance is comparable across sites.
The building's history stays with the building, not with the people who held it.

28
checks in every 100 that a human roster can realistically deliver today
36
of the remaining 72 that PEAK's AFDD library automates across BMS and mechanical
36
still uncovered — the honest remainder, and the roadmap
The portfolio you thought you knew, you didn't.
The system that makes the gap visible is the one that closes it.
What it's worth
Put your own portfolio into it.
Three inputs, no form, no email address. The ranges are CIM's delivered outcomes applied to the shape of your portfolio — a sighting shot before you talk to anyone, not a quote.
Your portfolio
Buildings
40
Sites you're accountable for
Annual energy spend
$12M
Across the portfolio, all fuels
Annual plant & maintenance capex
$8M
Replacement and major works

Energy and emissions savings, per year
$1.2M – $3.0M
10–25% of energy spend · stages 03–05

Capex deferred on condition evidence
$640k – $800k
8–10% equipment life extension · stages 02 + 06

Engineering capacity returned
10–15%
Roughly 4–6 sites' worth of engineering time across 40 buildings

Ratings and disclosure position
Evidence-based
Every number across 40 buildings traceable to a verified operational event · stage 06
How this is calculated.
Ranges are CIM's delivered outcome bands applied straight to your inputs — no adjustment for building type, climate, plant age or existing controls maturity, all of which move the answer. Treat it as a sighting shot. The full ROI model accounts for them.
17.4M kWh
Verified energy savings · Charter Hall · 60+ buildings
One measured result standing behind the bands. Charter Hall runs PEAK across 60+ buildings and 15M sq ft, with 50% of buildings lifting their NABERS rating in the first twelve months.
Portfolios already running on PEAK
Three named owners. Three operating problems. Three sourced outcomes.

Ben McCluskey
Operations Efficiency Manager, Charter Hall
Energy and emissions savings
“15M sq ft under continuous monitoring. Waste patterns became booked savings across the portfolio, and 50% of buildings lifted their NABERS rating in the first twelve months.”

Damien Stacey
National Capital & Planning Manager, QIC
Extension of equipment life
“Of six chillers scheduled for replacement, PEAK's condition analysis showed only one needed immediate action — five years of capex deferred on equipment evidence rather than age.”

Simon Howard
Co-Head of Australia, LaSalle
Ratings and disclosure position
The system produced both the improvement and the audit trail behind it, so the rating gains stood up under independent verification rather than needing to be re-argued.
What changes Monday morning
Same team. Same buildings. Same contractors. Different operating system.
The Monday question
Before
You find out what needs attention by chasing people — emails, the contractor, whoever walked the site last. By the time you've assembled the picture it is Tuesday.
The Monday meeting
Before
Status comes from emails, trackers and whoever was on site last week. Half the meeting is spent agreeing what's actually true.
The fault report
Before
The team finds out about a fault when a tenant calls, a contractor escalates, or an alarm finally gets noticed.
The contractor visit
Before
The contractor decides what to look at on site. You hear back in a report a week later.
The handover
Before
When an FM, engineer or BMS contractor leaves, the building's institutional knowledge goes with them.
The Monday question
On PEAK
You ask. "What needs attention across the portfolio this morning?" — in plain English, in Claude, ChatGPT or Copilot. PEAK answers from live data: priorities, owners, open actions, by site. No dashboard to open, no report to wait for.
The Monday meeting
On PEAK
Status comes from one live view, monitored in real time, that everyone in the room can see. The meeting starts at the decision instead of ending there.
The fault report
On PEAK
The team finds out when PEAK does — with priority, root cause, recommended action and named owner already attached.
The contractor visit
On PEAK
The contractor arrives with a triaged list, closes faults against tracked workflows, and the work is verified against the building's data before it counts as closed.
The handover
On PEAK
The building's history stays with the building. The system is the institutional memory.
Flip the switch — five moments in an operations week
The team doesn't grow. The operating system does.
None of that is a people problem. It's what happens when the operating layer is email.
Independent recognition
Recognised by the people who use it, and the industry it serves.

Peer reviews

/ 5
Average rating across 72 verified reviews.
8.9 / 10
Likelihood to recommend.
Industry awards and analyst recognition

Best Customer Support
Software Advice
Capterra Shortlist
Building Maintenance
Smart Innovators
Verdantix 2025
Category Leaders
GetApp
Front Runners
Software Advice
Sustainability Leaders
AFR with BCG
Digital Development of the Year
Energy Awards 2026
Green Transformation Award
Climate Tech Impact Award
Common questions
The questions operations leads ask first.
PEAK reads from your existing BMS over standard protocols — BACnet, Modbus and Niagara — plus direct meter and IoT feeds. A language model standardises and QAs the raw data against one unified ontology, so there's no six-month point-tagging project per site.
Your team starts in a live deployment, not an integration project. See how detection works →
No. PEAK is BMS-agnostic and sits across your data rather than on top of one stack. Your BMS, your meters, your CMMS and your existing reporting tools all stay in place. PEAK pulls from them and gives the operations team one continuous view across the lot.
Weeks, not quarters. Auto-commissioning brings new sites online in under 30 days. Most portfolios produce their first verified close-out inside eight weeks of contract. Eagle Street Partners onboarded in 16 days.
Your team does. PEAK gives your operations team the single live view, and your contractors work to it: they arrive with a triaged list, close faults against tracked workflows, and the work is verified before it counts as closed.
You stay in control of the building. If you'd rather a service partner ran the system on your behalf, that model exists too — see the partner route →
Yes, because every rating number is traceable to a verified operational event rather than an annual reporting exercise. Charter Hall improved NABERS Energy ratings on nearly half its office properties after engaging CIM. KYKO took a building from 0 to 5 NABERS stars in a single rating cycle.
Ratings improve because the buildings genuinely perform better. See the ratings solution →
Yes. Connect Claude, ChatGPT or Microsoft Copilot to PEAK through the Model Context Protocol and ask your portfolio in plain English — triage urgent alerts, chase open actions, check site health, from the chat tools your team already uses.
Permissions follow your existing PEAK login, so people only see the sites they already have rights to.
It's the right question, and the honest answer is that adoption depends on whether PEAK deletes more work than it creates. It's built to: the AI filters the routine verification a human roster was never going to finish, so engineering hours land on diagnosis and corrective action instead of hunting.
Human authority is architectural, not a setting. The AI recommends and chases; it doesn't write to plant and it doesn't act without a person. Every recommendation can be interrogated down to the rule and the raw data behind it.
Pricing depends on portfolio size and what's in scope. Book a call and we'll walk you through it.
Go deeper
Take something with you. Short paths to understand PEAK without a call.
Guide · 8 min read
AI Portfolio Playbook
Where operations leaders create measurable value: contractor and supply chain performance, multi-horizon planning, operational efficiency, ratings and governance, faster fault resolution, and one unified operating system.
Video · 2 min
PEAK system overview
A short walk-through of the system an operations team uses every day. The dashboards, the fault workflow, the contractor view, the reporting layer. Real screens, no marketing.
Pick the one that fits where you are.
The system is the same on every building. The starting point is yours to pick.